ECON 2B03 Lecture Notes - Standard Deviation, Interquartile Range, Skewness

14 Oct 2013
School
Department
Course
Professor
Document Summary
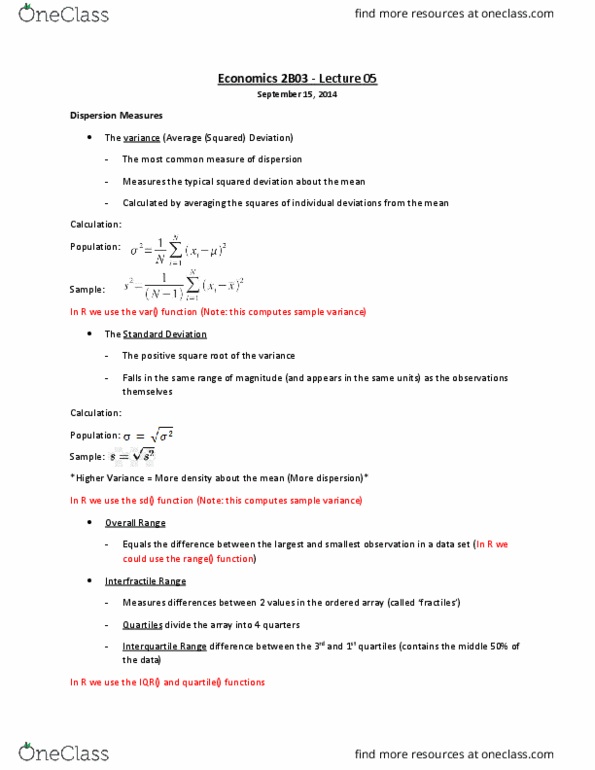
Dispersion measures: the variance (average (squared) deviation) Measures the typical squared deviation about the center of the data using the arithmetic mean. Calculated by averaging the squares of the individual deviations from the mean. In r we use var( : the standard deviation. Equals the difference between the largest and the smallest observation in a data set (in r we could use the range ( ) function). Interfractile ranges (2 numbers that contain half the data) Definition: measure difference between 2 values (called fractile or percentile) in the ordered array: quartiles, interquartile range: middle 50% of data) divide the array into 4 quarters difference between 3rd and 1st quartiles (contains, deciles (ie: the median) : divide the array into 10 parts at the center of the range. In r we use the iqr ( ) and quantile ( ) functions. Shape measures: skewness: definition: a measure of symmetry.