ECON 2B03 Lecture Notes - Lecture 1: Frequency Distribution, Observational Error

5 Feb 2017
School
Department
Course
Professor
Document Summary
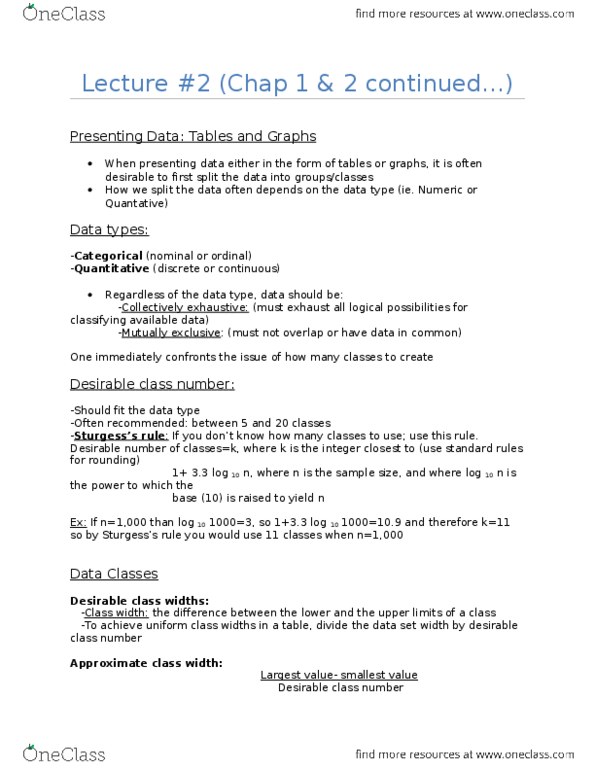
When presenting data either in the form of tables or graphs, it is often desirable to first split the data into groups/classes. How we split the data often depends on the data type. Regardless of the data type, data classes should be: Collectively exhaustive (must exhaust all logical possibilities for classifying available data) Mutually exclusive (must bot overlap or have data in common) One immediately confronts the issue of how many classes to create. Sturgee"s rule: desirable number of classes = k. an integer, where k is the integer closest to (use standard rules for rounding|) 1 + 3. 3log base 10 n, where n is the sample size where log base10 n is the power to. Which the base 10 is raised to yield n. Class width = the difference between the lower and upper limits of a class. To achieve uniform class widths in a table, divide data set width by desirable class number.