EARTHSC 2WW3 Lecture 6: Lecture 6 Notes

25 Dec 2015
School
Department
Course
Professor
Document Summary
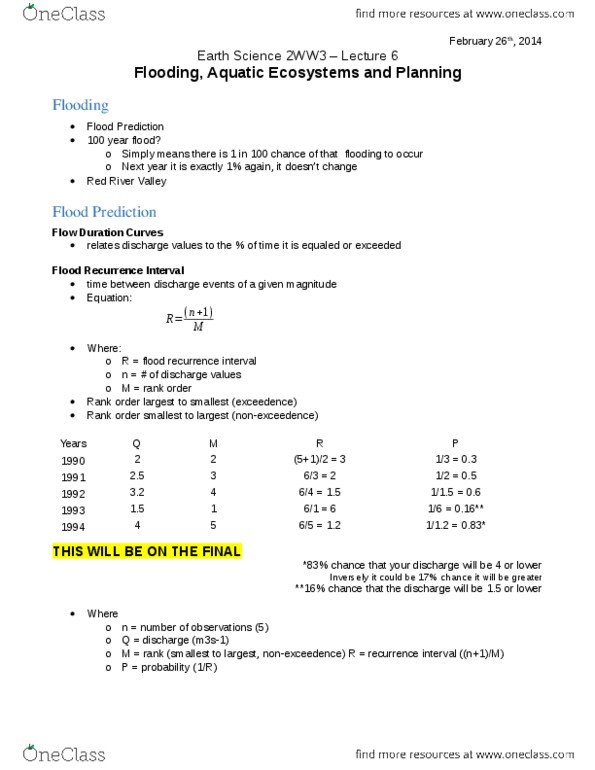
February 26, 2014: simply means there is 1 in 100 chance of that flooding to occur, next year it is exactly 1% again, it doesn"t change. Flow duration curves relates discharge values to the % of time it is equaled or exceeded. Flood recurrence interval time between discharge events of a given magnitude. M: r = flood recurrence interval, n = # of discharge values, m = rank order. *83% chance that your discharge will be 4 or lower. Inversely it could be 17% chance it will be greater. **16% chance that the discharge will be 1. 5 or lower. Where: n = number of observations (5, q = discharge (m3s-1, m = rank (smallest to largest, non-exceedence) r = recurrence interval, p = probability (1/r) ((n+1)/m) *will never have to fill out this graph* Take historical data, plotting it on the graph, do the line of best fit and intercept with the return period.