PSYC 305 Lecture Notes - Lecture 18: Simple Linear Regression, Statistical Hypothesis Testing, Null Hypothesis

23 Mar 2017
School
Department
Course
Professor
Document Summary
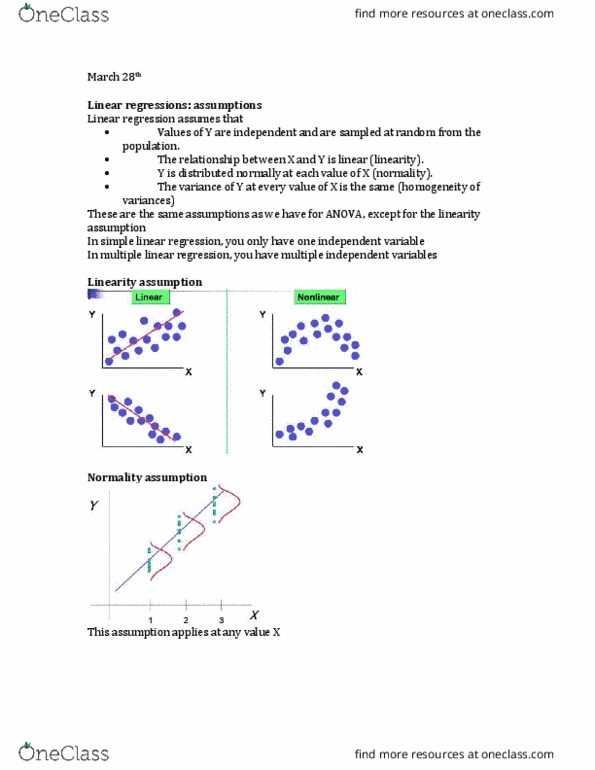
A straight line relating y to x has an equation of the form: Y = a + bx a = intercept. = slope (the effect of your independent variable on your dependent variable) In the end, we decide if a and b are simply in linear regression. Finding a straight line which explains well the relationship between two variables. It is very important how we interpret the values of a and b a = intercept. We assume that income may affect purchase spending. There are an infinite number of lines we can consider. Based on some principle that we will discuss very shortly, the red line is the best line. When we have a scatterplot with a linear relationship between the dv (y) and a single iv (x), we are often interested in summarizing the overall pattern. We can do this by drawing a line on the graph.