STAT 2507 Lecture Notes - Lecture 2: Know Nothing, Interquartile Range, Quartile

29 Jan 2018
School
Department
Course
Professor
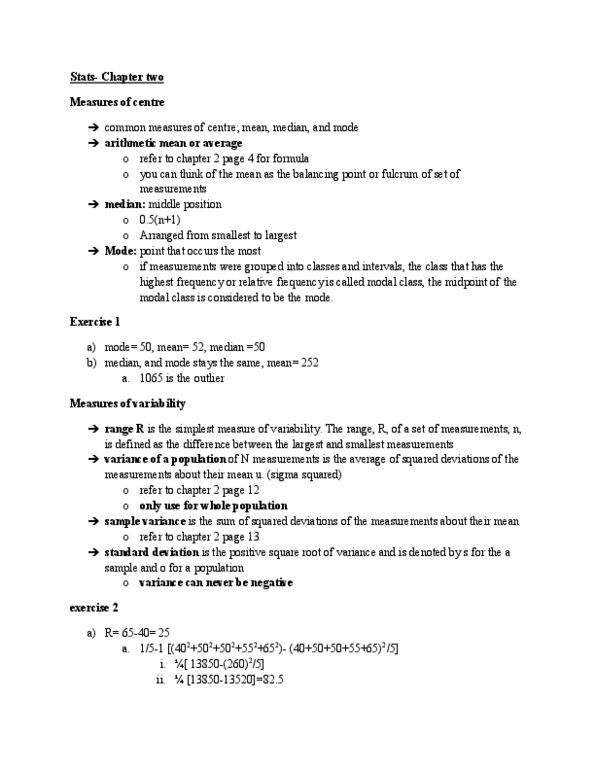
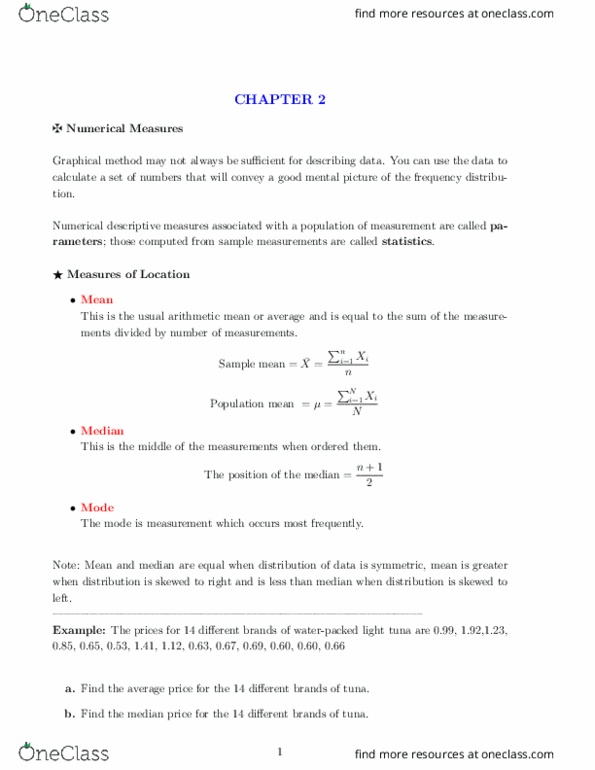
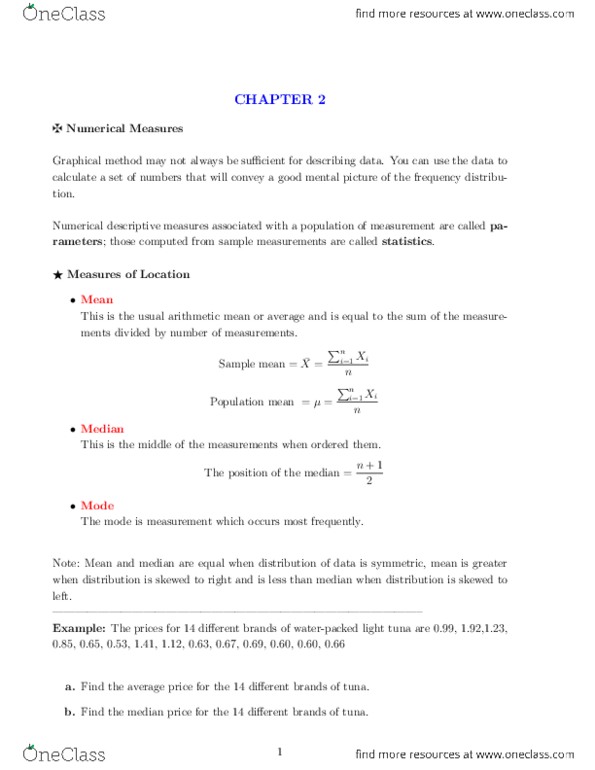
Document Summary
Measures of centre are good in determining the centre of distribution but do not tell us anything about the spread of the data. Two data sets can have the same centre but different spread. Hence, to understand the distribution of a data set, knowledge of how the measurements vary or spread is very important. Measures of variability provide us with an idea of the spread or variability of the data. Definition: the range r is the simplest measure of variability. The range, r, of a set of measurements, n, is defined as the difference between the largest and smallest measurements. Another way of measuring variability in a data set is by using the variance. Definition: the variance of a population of n measurements is the average of squared deviations of the measurements about their mean . The population variance is denoted by o^2 and can be calculated as follows.