PSYC 3000 Lecture Notes - Lecture 5: Scatter Plot, Abscissa And Ordinate

9 Sep 2015
School
Department
Course
Professor
Document Summary
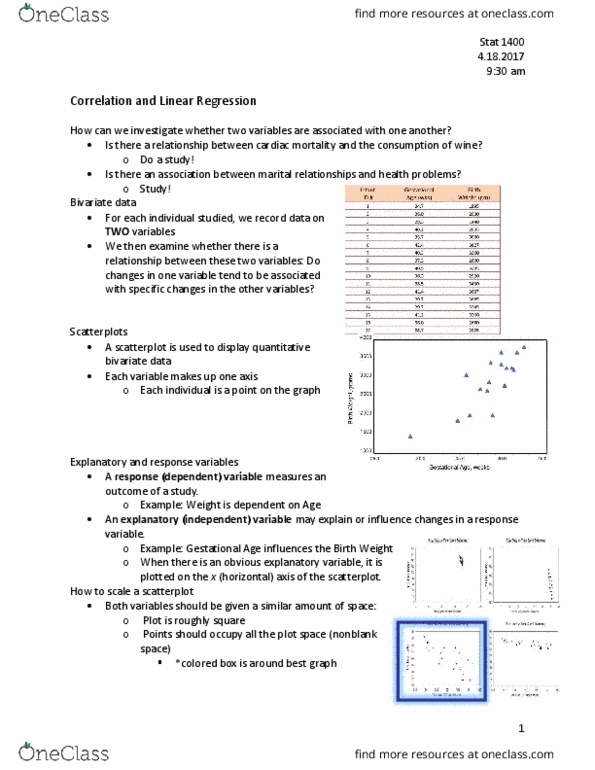
Data comes in pairs of quantitative variables (bivariate data) We want to determine whether there is a linear relationship between the 2 quantitative variables. What: scores on intimacy and the commitment. The variable labeled x is plotted on the horizontal axis (the abscissa) The y variable is plotted on the vertical axis (the ordinate) The score of a subject on each of the two measures is indicated by one point on the scatterplot. When looking at scatterplots, we will look for direction, form, strength, and unusual features. Strength: how closely the points fit the form . If for each value of x, there is a small spread of y values, then there is a strong association between x and y. If for each value of x, there is a large spread of y values, then there is a weak or no association between x and y. A more objective method to describe a linear relationship is the linear correlation coefficient.