NEUR 2002 Lecture Notes - Lecture 11: Null Hypothesis, Statistical Hypothesis Testing

25 Feb 2019
School
Department
Course
Professor
Document Summary
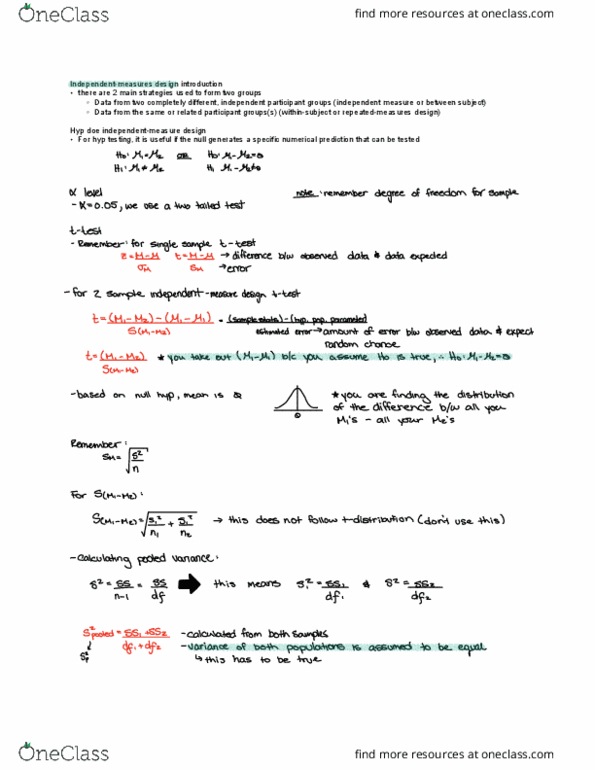
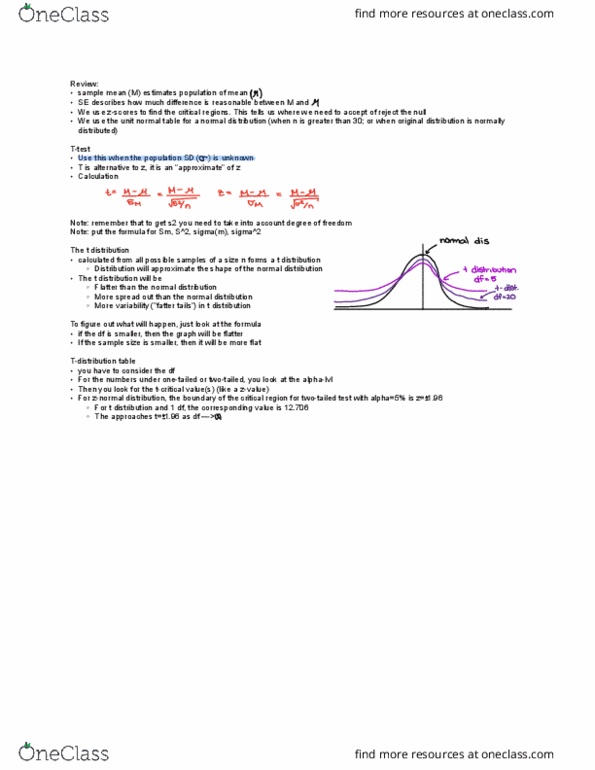
T distribution you don"t know the population sd, so this is when you use the t-test. Remember that the t-test takes into account the degree of freedom. Sm will be larger than standard error - this means that there is more spread, so the graph will be flatter. If n is smaller, the t-distribution will be flatter. You still use the same 4 steps (generate hyp and null, find alpha, collect data, make decision) Only difference is that you use the t-distribution table. State the hyp and null hyp t m. mu m. Null: of the 60 mins trial, we predict that birds will spend 30 mins in the plain chamber. I in this way, they null hyp provides a specific value for the of the hypothesized population. Mo 30mins el 430mins premember to write it forpop. In this case, alpha is 0. 05 and we are using a two-tailed test. Mean times spent in plain chamber is m=36 minutes.