CIVE 2700 Lecture Notes - Lecture 7: Phase Diagram, Phase Rule, Phase Boundary

13 Apr 2016
School
Department
Course
Professor
Document Summary
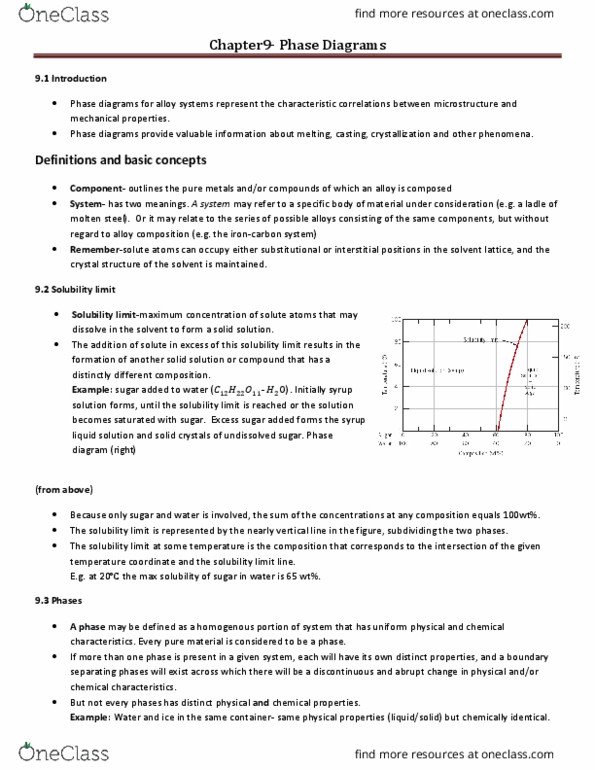
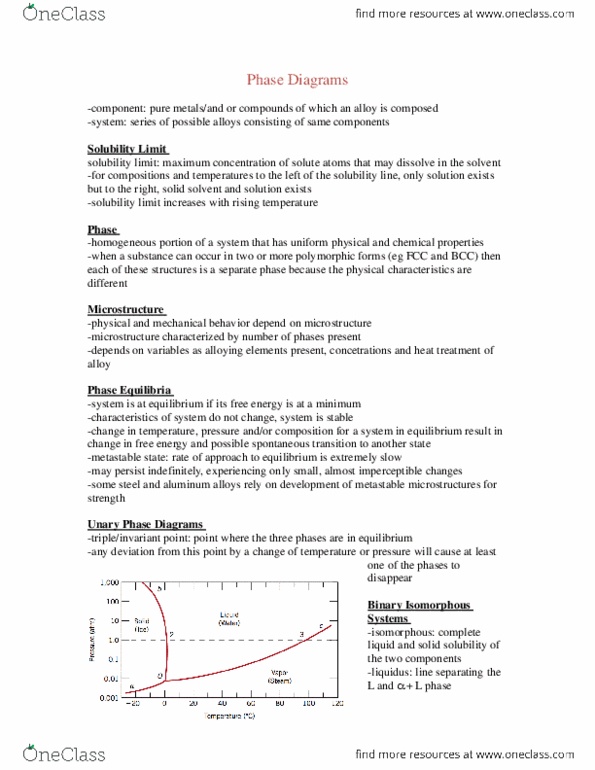
A phase diagram is a plot showing the phases of a substance at various temperatures and pressures. Usually pressure vs. temperature or temperature vs. composition graph is plotted. We study phase diagrams because it relates the development of microstructure of a substance. In addition, phase diagrams provide valuable information about melting, casting, crystallization and other phenomena: definitions. Components: components are pure metals and/or compounds of which an alloy is composed. E. g. copper zinc brass has components copper (cu) and zinc (zn). Solvent: the element or compound that is present in the greatest amount. Solute: an element or compound present in minor concentration. System: (1) a specific body under consideration or (2) it relates to the series of possible alloys consisting of the same components e. g. iron-carbon system: solubility limit. For many alloy systems and at some specific temperature, there is a maximum concentration of solute atoms that may dissolve in the solvent, this is the solubility limit.