CGSC 2002 Lecture Notes - Lecture 6: Normal Distribution, Interquartile Range, Standard Deviation

18 Mar 2018
School
Department
Course
Professor
Document Summary
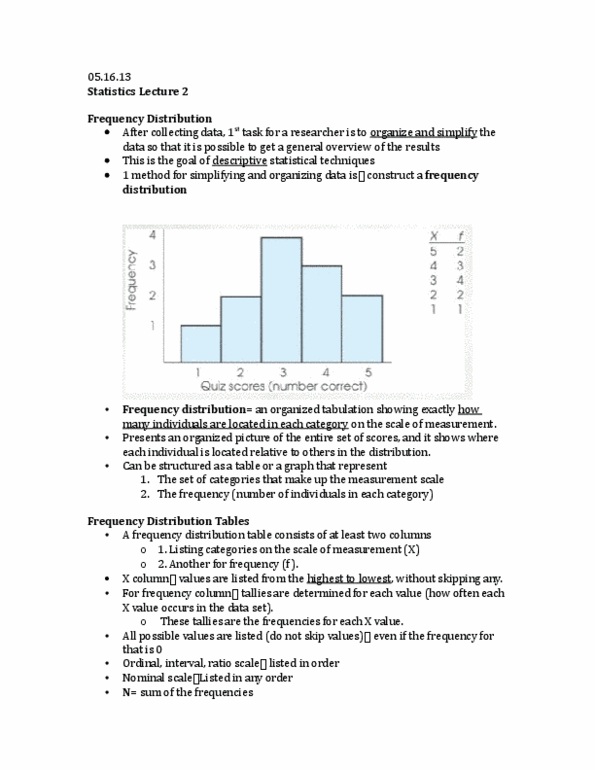
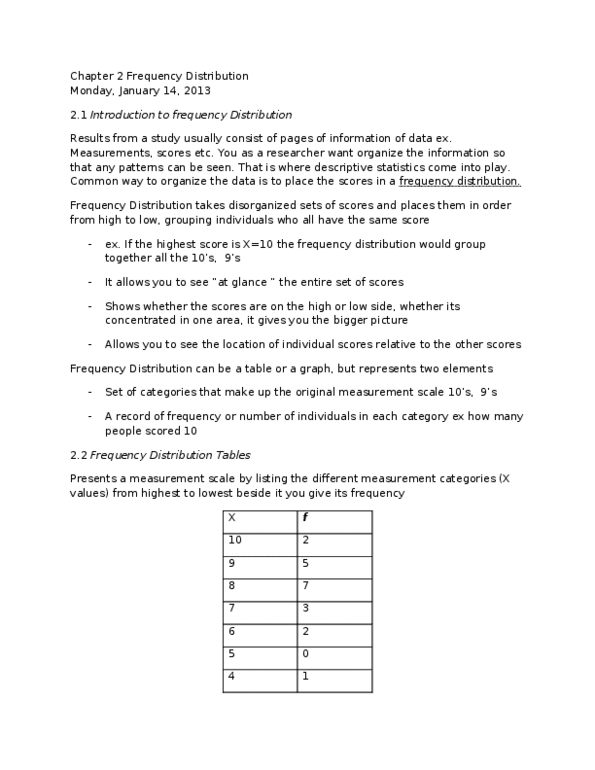
The distribution of data is a summary of the frequency of individual values or ranges of values for the target variable. If the measurement scale is categorical, then the distribution shows us the number of values for a given category. Example: numbers of demonstrated possessions range from 90 to 120. As a researcher of animal cognition, my hypothesis might be that grey shrike males care not only about the quantity of. Possessions but also quality (e. g. , bigger possessions are more valuable, or rare possessions are move valuable etc. ) If the measurement scale is continuous, the frequency distribution is uninformative. The solution to this problem is to create a grouped frequency distribution. When describing the distribution, it is useful to include information on: Has the same number of values on each side. A skewed distribution has more values on one side than the other. Another way of saying this is that a skewed distribution has a longer tail on one side.