MATH 1F92 Lecture Notes - Lecture 3: Dependent And Independent Variables, Scatter Plot

7 Oct 2016
School
Department
Course
Professor
Document Summary
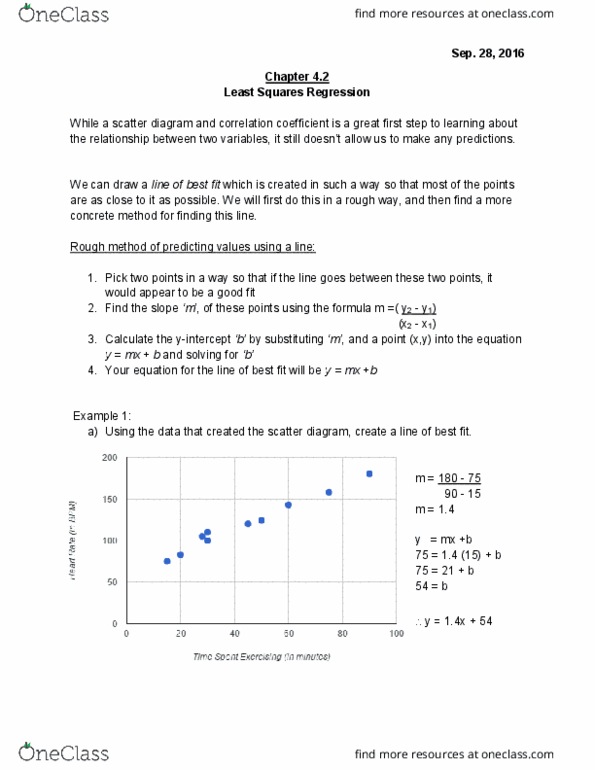
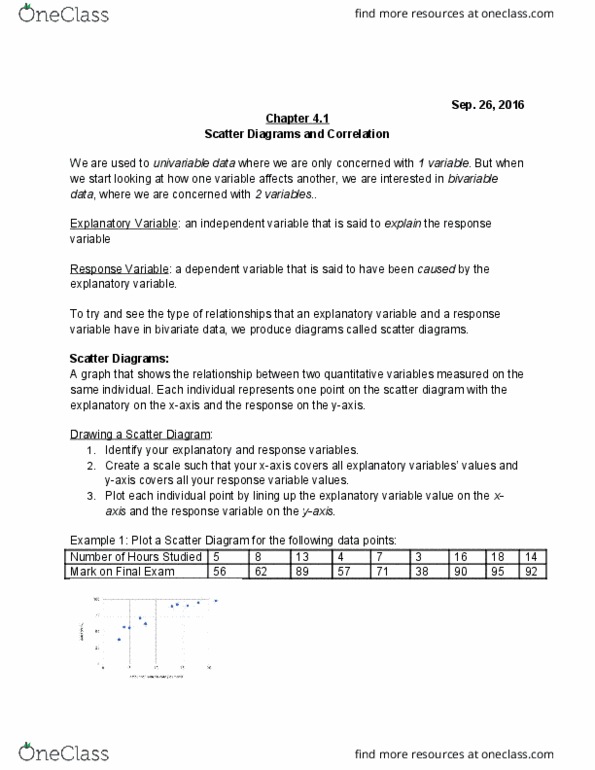
From our previous lecture, we developed scatter diagrams and learned about the correlation coefficient in order to find the strength and association between two variables. While a scatter diagram and correlation coefficient is a great first step to learning about the relationship between two variables, it still doesn"t allow us to make any predictions. ______________________ which is created in such a way so that most of the points are as close to it as possible. We will first do this in a rough way, and then find a more concrete method for finding this line. ____________ and solving for b: your equation of line of best fit will be y=mx+b. Example 1: a) using the data that created the scatter diagram, create a line of best fit. Now that we have this equation, we can substitute in some time in minutes a person exercises and we will receive a predicted heart rate for that amount of time.