CHYS 2P52 Lecture Notes - Lecture 7: Statistical Hypothesis Testing, Square Root, Standard Deviation

7 Dec 2017
School
Department
Course
Professor

Document Summary
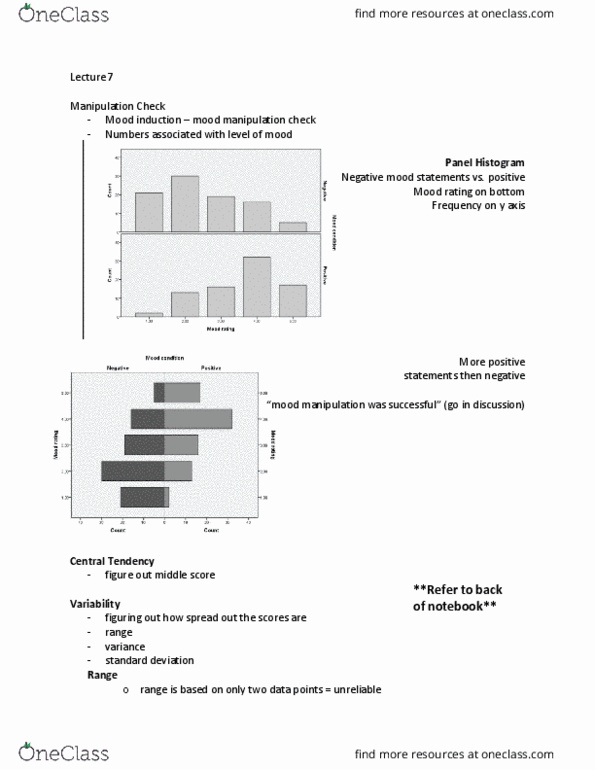
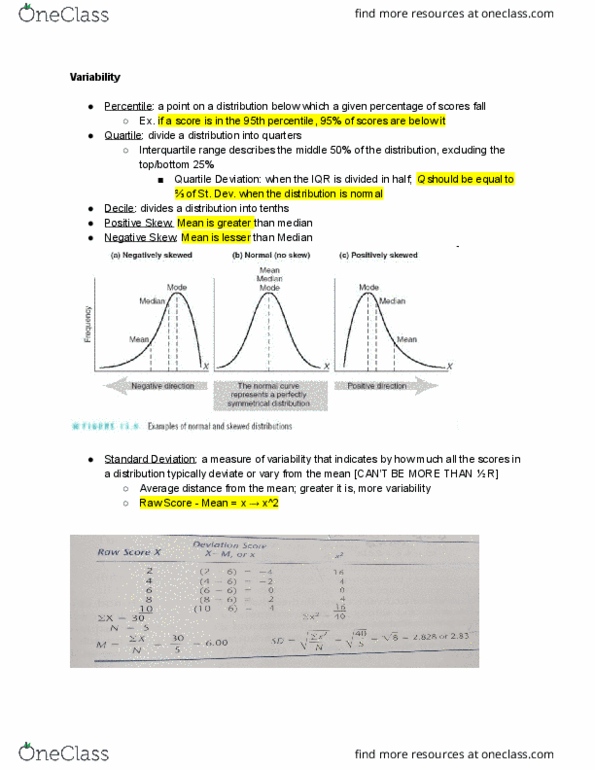
Looking at our data: manipulation check: negative (1, somewhat negative (2, neutral (3, somewhat positive (4, positive (5) How far are the scores from the middle (how spread out) Range: useless, tells distance between top most and bottom most score, easy to calculate, based on two data points (unreliable) Median of the top half of the distribution is q75 (75th percentile) Median is the 50th percentile because there will be exactly 50% of scores above and below. Median of bottom half is q25 (25th percentile) Iqr (interquartile range) = q75-q25 (represents the middle 50% of the scores: middle scores tend to be more stable. Skew of a data set by looking at the right or left side of the box, right side negative, left side positive skew. Variance calculation: s^2 = (x- x) ^2/n-1: mean and variance closely linked together, unbiased (number mean) squared divided by the number minus one, how far are all of those scores from.