26134 Lecture Notes - Lecture 10: Null Hypothesis, Test Statistic, Standard Deviation

Document Summary
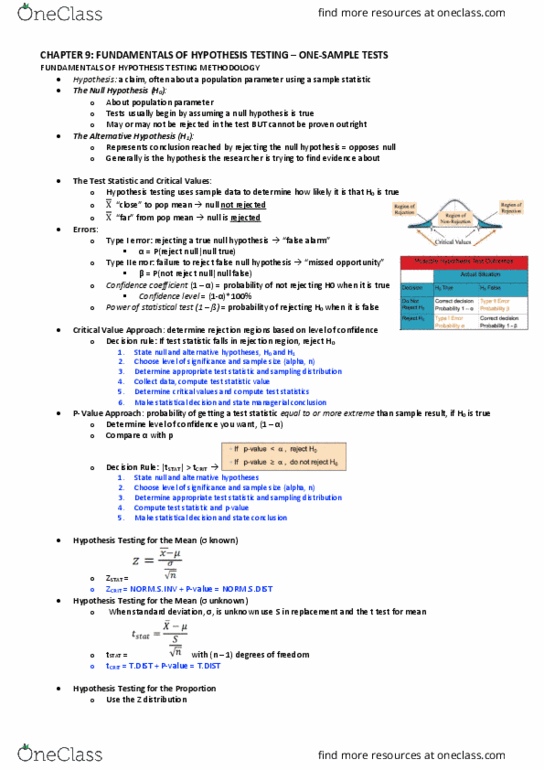
Chapter 9 statistical inference: hypothesis testing for single populations. A null hypothesis h0 is maintained to be true unless sufficient evidence contradicts it. Alternative hypothesis ha is what the null hypothesis is tested against and is accepted is the (cid:374)ull h(cid:455)pothesis is reje(cid:272)ted. The (cid:449)ord (cid:862)sig(cid:374)ifi(cid:272)a(cid:374)t(cid:863) is ofte(cid:374) asso(cid:272)iated (cid:449)ith it. Alpha () is the acceptable error level when sampling (assume = 0. 05 unless told and for two-tailed test used alpha/2 = 0. 025). Changing alpha to a smaller value, requires stronger evidence to reject h0. To test the hypotheses, we must compare the test statistic with the critical value. The critical value marks where the rejection region is. When given population standard deviation, the critical value can be found using a z-table. This is compared to the z test statistic: When we are not given population standard deviation, we use a t-table to calculate the critical value and compare it to the t statistic.