KHA350 Lecture Notes - Lecture 2: Dependent And Independent Variables, Statistical Significance, Mylo

25 Jun 2018
School
Department
Course
Professor

Research methods week 2: ANOVA
Last week:
- use t test or ANOVA to test for differences between sample means
- Independent: means, sd, sample sizes & t(df) = value, p
One way ANOVA:
- Logic: we can describe any persons score as the result of the sum of three key
components
oScore= grand mean + treatment effect + residual error
oScore = average height + sex effect + uniqueness
oCan be generalized:
X = U + (U1- U) + e
Population mean condition = deviation from grand mean of
condition + variation of individual from group mean
- Works by break down variance down into two scores:
oVariation due to treatment/effects of this
oError variance
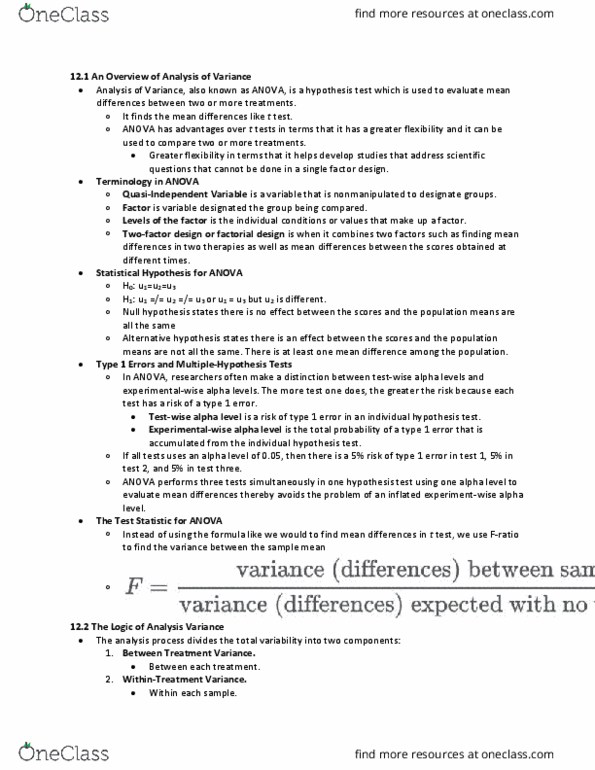
- Comparison of these two estimates of variance produces F statistic
- Study example:
oTen subjects were assigned to each of five learning groups
Counting
Rhyming
Adjective
Imagery
Intentional
oEach learning group represents a separate population of scores
oIf learning involves nothing more that being exposed to material there
should be no difference in recall
oIf important, there should be a noticeable difference in recall ability
oDV: number of words recalled
oIV: one IV with five levels; five groups; each condition
oHypotheses: each of these learning groups (conditions) represents a
separate population, so we can use different notation
Sample: s
Population: U
Null: H0 = U1 = U2 = U3 = U4 = U5
oAssumptions:
Homogeneity of variance: the standard deviations for each of
the group in the study, there is equal variation
The average SD across the groups
Some groups were sd are larger than others, then it will
be a crappy estimate of the average
Normal distributed: bell shaped curve
Independence of observations:
Knowing about one persons score wont give insight to
another
- Sums of square (SS):
oHOW TO CALCULATE EACH PART OF THE VARIANCE
find more resources at oneclass.com
find more resources at oneclass.com
Document Summary
Last week: use t test or anova to test for differences between sample means. Independent: means, sd, sample sizes & t(df) = value, p. X = u + (u1- u) + e. Population mean condition = deviation from grand mean of condition + variation of individual from group mean. Works by break down variance down into two scores: variation due to treatment/effects of this, error variance. Comparison of these two estimates of variance produces f statistic. Study example: ten subjects were assigned to each of five learning groups. Null: h0 = u1 = u2 = u3 = u4 = u5: assumptions: Homogeneity of variance: the standard deviations for each of the group in the study, there is equal variation. Some groups were sd are larger than others, then it will be a crappy estimate of the average. Knowing about one persons score wont give insight to.