BUSS1020 Lecture Notes - Lecture 7: Confidence Interval, Common Application, Central Limit Theorem

22 Aug 2018
School
Department
Course
Professor

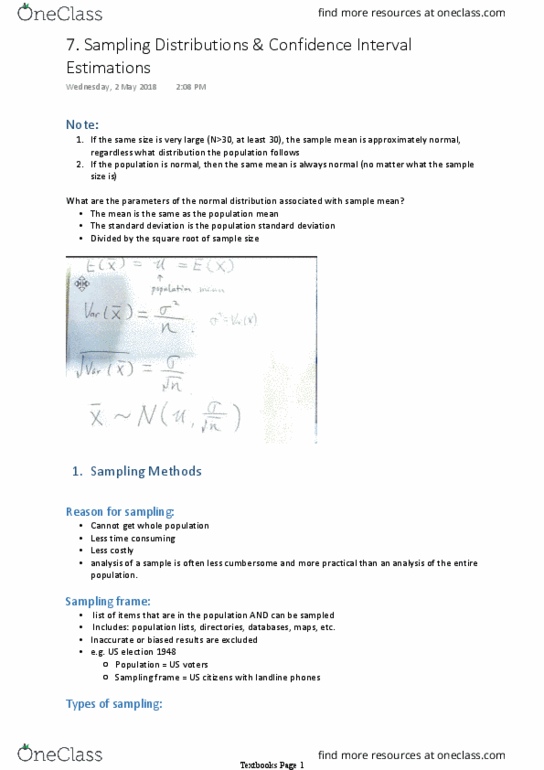
BUSS1020 Lecture 7 – Sampling Distributions
- Sample size increases, variability decreases, standard error decreases
➢ Closer to truth
- Sample size too large (approach infinity) → no variability
Why Sampling?
- Can’t get whole population
- Less time-consuming & costly than selecting every item in population (census)
- Analysis of sample is less complicated & more practical than analysis of entire
population
Sampling should begin with a Sampling Frame
- List of items in population & can be sampled
- e.g. population lists, directories, databases, maps
- excludes parts of population → inaccurate or biased results
- e.g. supermarket
entire population – employees in all supermarkets in NSW
sample – employees in Coles & Woolworths
➢ biased sample – Coles & Woolworths take most talented ones in the industry
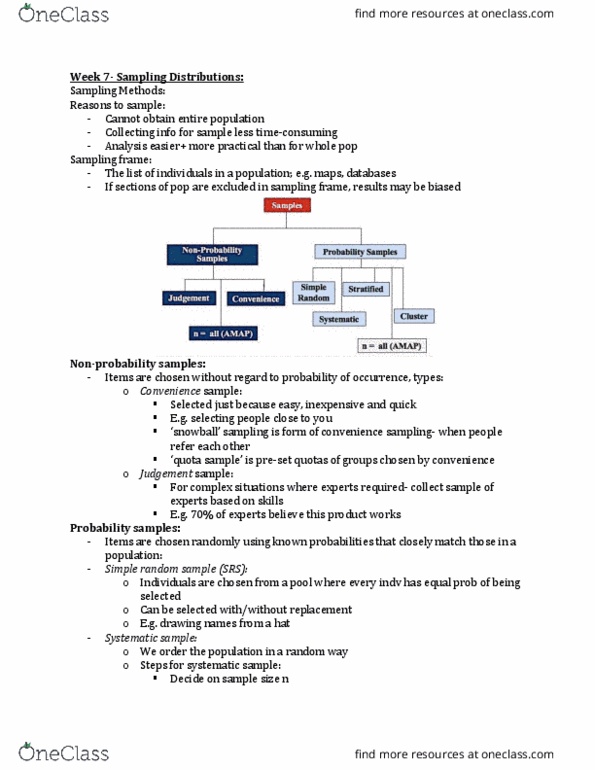
Types of Samples
Non-probability Samples
- items are chosen without regard to probability of occurrence
➢ Convenience Sample – based on being easy, inexpensive & quick to sample
➢ “snowball” sampling
➢ Judgement Sample – perceived experts or select most appropriate items, by
convenience
➢ Quota Sample – pre-set quotas of groups chosen, by convenience
▪ Use when multiple categories/groups (e.g. ages & gender)
Probability Samples
- Items chosen randomly using known probabilities that closely match those in population
Simple Random Sample (SRS)
- Every individual or item in the frame has equal chance of being selected
- With replacement – e.g. rolling dice, playing cards, flipping coins
- Without replacement

- Obtained with the help of random no. generator/table or software
➢ In excel, =RANDBETWEEN(1st item no, last item no)
➢ Match selected no. to the item & include it in the sample
➢ Keep repeating it till required sample size
Systematic Sample
- Decide on sample size: n
- Divide frame of N individuals into groups of k (no. of individuals in each group)
➢ Individuals: k = N/n
- Randomly select 1 individual from 1st group (use =RANDBETWEEN)
- Select every kth individual thereafter
- E.g. select 7th individual in 1st group, also select 7th individual in each other groups
Stratified Sample
- Divide frame into strata according to an important characteristic, e.g. gender, ethnicity
➢ Ensures minority groups are included
- An SRS is selected from each strata frame
➢ Sample size proportional to size of each strata → ensures proportionate
representation
- Samples from subgroups are combined into 1 sample
- Common technique when sampling populations of voters – stratifying across racial,
socio-economic or other important variables
Cluster Sample
- Population is divided into several “clusters”, each representative of population
- An SRS of clusters is selected (not using all clusters just like strata & groups)
- All items in selected clusters can be used / items can be chosen from a cluster using
another probability sampling technique
- Common application – election exit polls
➢ Certain election districts are selected & fully sampled
Comparing Sampling Methods
- SRS & Systematic Sampling
➢ Simple, cheap to use, effective against many types of bias
➢ May not give best representation of population’s underlying characteristics
- Stratified Sampling
➢ Ensure representation of individuals across entire population, possibly in right
proportions
➢ Effective against bias
➢ Most efficient method, but costly (to find & group specific individuals)
Document Summary
Sample size increases, variability decreases, standard error decreases. Sample size too large (approach infinity) no variability. Less time-consuming & costly than selecting every item in population (census) Analysis of sample is less complicated & more practical than analysis of entire population. Biased sample coles & woolworths take most talented ones in the industry. Non-probability samples items are chosen without regard to probability of occurrence. Convenience sample based on being easy, inexpensive & quick to sample. Judgement sample perceived experts or select most appropriate items, by convenience. Quota sample pre-set quotas of groups chosen, by convenience: use when multiple categories/groups (e. g. ages & gender) Items chosen randomly using known probabilities that closely match those in population. Every individual or item in the frame has equal chance of being selected. With replacement e. g. rolling dice, playing cards, flipping coins. Obtained with the help of random no. generator/table or software. In excel, =randbetween(1st item no, last item no)