BUSS1020 Lecture Notes - Lecture 3: Skewness, Kurtosis, Triangular Distribution

22 Aug 2018
School
Department
Course
Professor
Document Summary
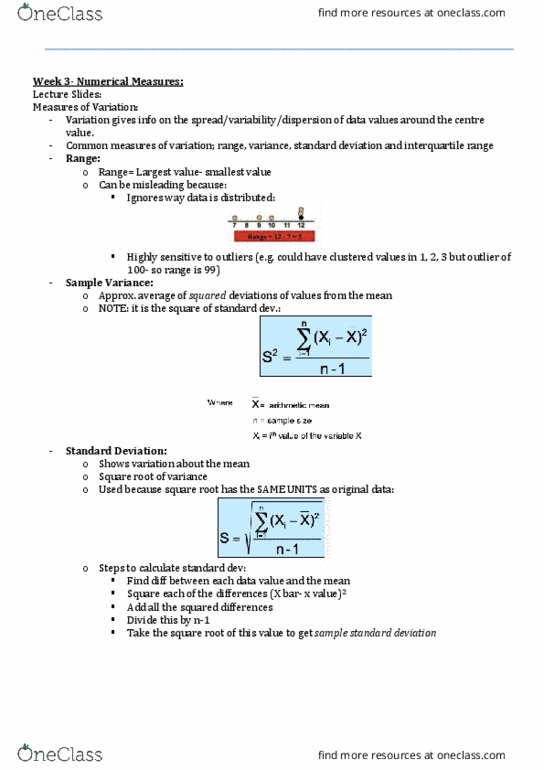
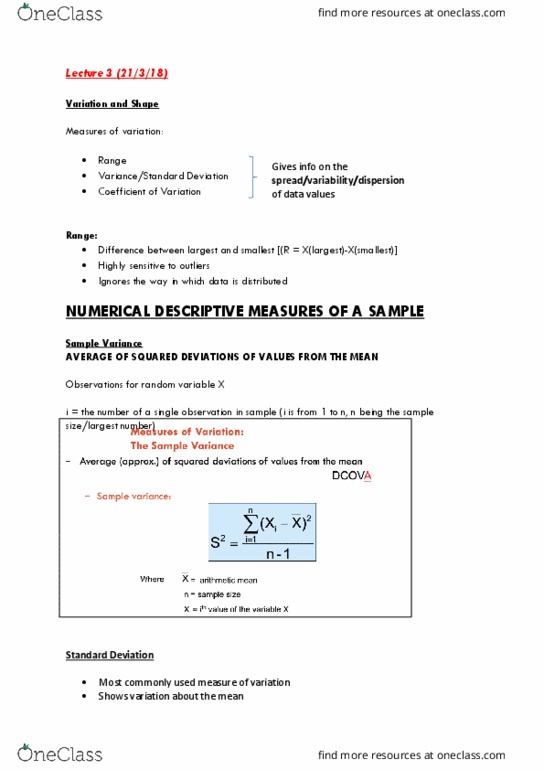
Population with identical mean /central tendency variance & standard deviation. Coefficient of variation comparing variability across different population with different means. Numerical descriptive measures for a sample (denoted with roman letters) Ignore the way in which data are distributed (visualisation) Variability of dispersion data are evenly distributed, but sometimes some data concentrates on a particular one. Highly sensitive to outliers e. g. if one data is extremely large lead to a large range. Sample variance average of squared deviations of value from the mean. Deviation of the sample mean i th value of variable x minus arithmetic mean (can be positive or negative) take square. Measures variability / volatility from an average determine risk an investor takes on when purchasing a specific security. Square root of sample variance take the positive root as the solution. Same unit as the original data (same as range) In excel, stdev. s = standard deviation bracket all data.