BUSS1020 Lecture 13: BUSS1020 Lecture 13

27 Jul 2018
School
Department
Course
Professor
Document Summary
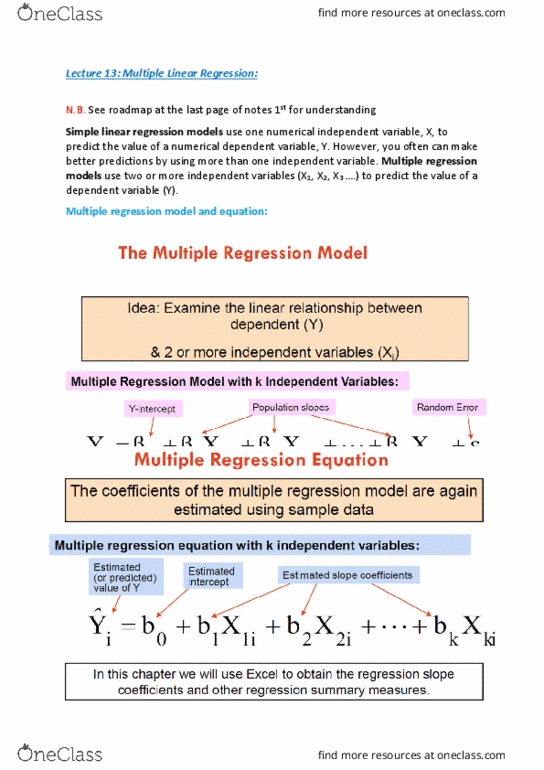
This chapter discusses multiple regression models that use two or more numerical independent variables, x, to predict value of a numerical dependent variable y. 3d scatter plots are often used as a starting point for analysis of multiple regression models. Interpreting the regression coefficients: the simple linear regression model can be extended by assuming a linear relationship between each independent variable and the dependent variable. E. g. with k independent variables, the multiple regression model is expressed as: like in simple regression, you use least-squares method to compute sample regression coefficients b0, b1, and b2 as estimates of the population parameters b0, Predicting dependent variable y: you just enter the x values into the equation, you should only predict within the range of the values of all the independent variables r2, adjusted r2, and the overall f test: Nb: in general the f stat can be defined as the quadratic function of a set of t stats.