BUSS1020 Lecture Notes - Lecture 2: Decimal Mark, Histogram, Contingency Table

27 Jul 2018
School
Department
Course
Professor
Document Summary
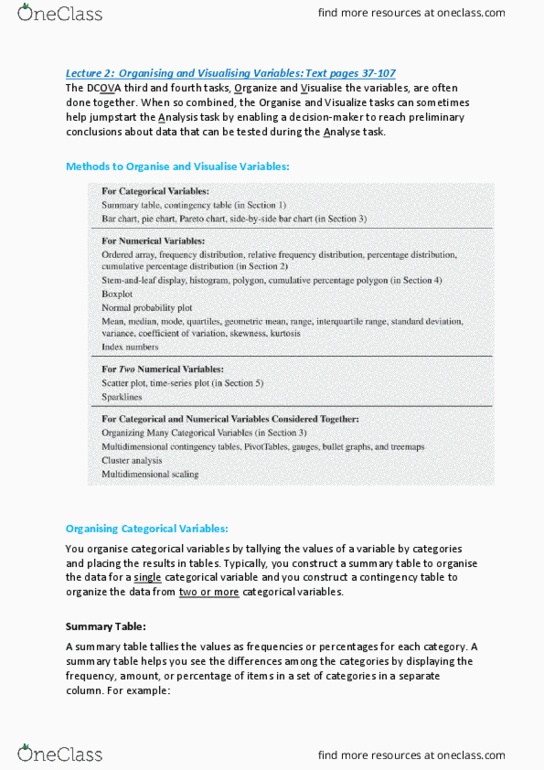
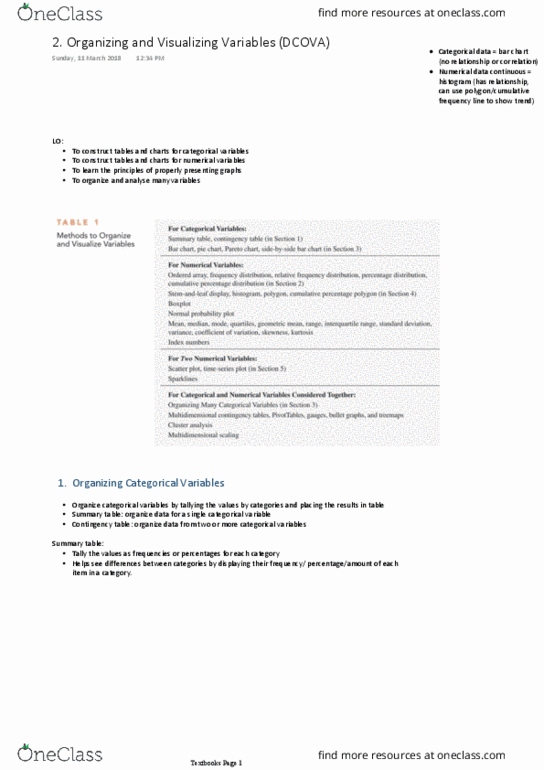
Lecture 2: (pg 65 135 in online e book or 42 112 in pdf: organising and visualising variables. When you organise data into tables, patterns and relationships become evident and in order to explore these, you can visualise your data by creating charts and special displays. Nb: methods for organising and visualising data vary if the variable is numerical or categorical. Summary table: is used to organise single category variables by tallying the values as frequencies or percentages for each category. This helps you see differences in the categories by displaying the frequency amount or % of items in a set of categories in a separate column. Example: asking 100 people what is there favourite colour. Contingency tables: used to organise data for multiple categorical variables. Numerical variables are organised by creating ordered arrays of one or more variable or by means of frequency or cumulative distribution.