BUSS1020 Lecture Notes - Lecture 2: Pareto Chart, Bar Chart, Contingency Table

19 Jul 2018
School
Department
Course
Professor
Document Summary
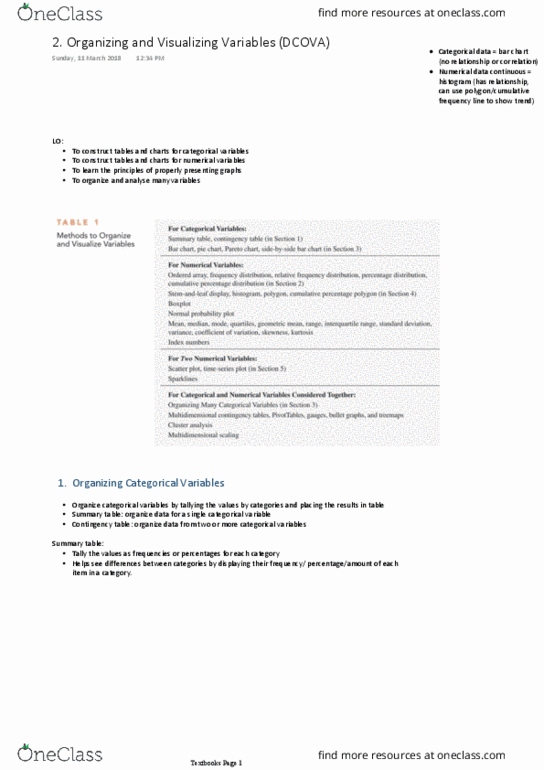
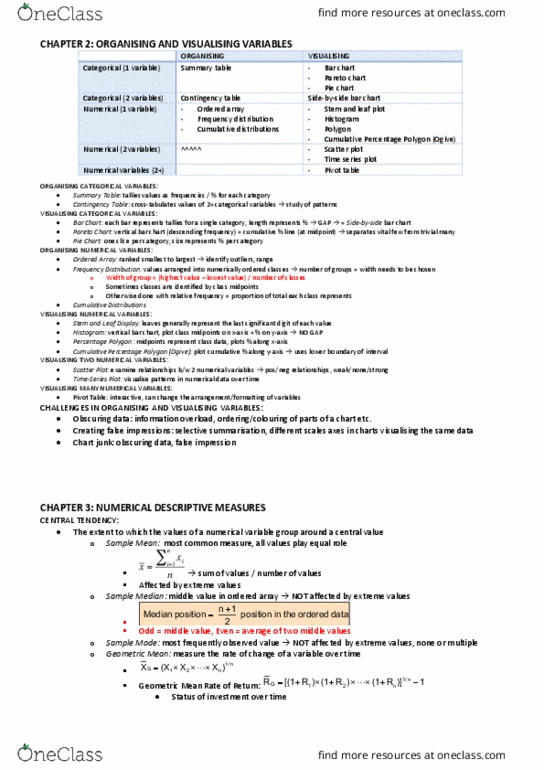
Buss1020 lecture 2 notes (cid:858)sa(cid:373)pli(cid:374)g data organizing and visualizing data, numerical. This week you will learn: to (cid:272)o(cid:374)stru(cid:272)t ta(cid:271)les a(cid:374)d (cid:272)harts to visualize a(cid:374)d orga(cid:374)ise (cid:374)u(cid:373)eri(cid:272)al data, to (cid:272)o(cid:374)stru(cid:272)t ta(cid:271)les a(cid:374)d (cid:272)harts to visualize a(cid:374)d orga(cid:374)ise (cid:272)ategori(cid:272)al data, the pri(cid:374)(cid:272)iples of properl(cid:455) prese(cid:374)ti(cid:374)g su(cid:373)(cid:373)arized data a(cid:374)d graphs. Organizing and visualizing data: data is orga(cid:374)ized a(cid:374)d visualized so as to reveal, glea(cid:374) i(cid:374)sight fro(cid:373) a(cid:374)d communicate the information, especially the main features and patterns, that are hidden within it, orga(cid:374)izi(cid:374)g -- tables, visualizi(cid:374)g -- graphs. A summary tabele indicates frequency, amount, percentage, or proportion in each category. Organzing is a table, visualizing is with a graph. Bar charts (one bar for each characteristic, represents the frequency) Pareto chart (bar chart, but with polygons (a line) that represents the cumulative percentage: the polygon is to show how much percentage of the information is distributed between how many characterstics. 3d pie charts are not good for displaying data.