MARK205 Lecture Notes - Lecture 10: Descriptive Statistics, Statistical Significance, Statistical Hypothesis Testing

Document Summary
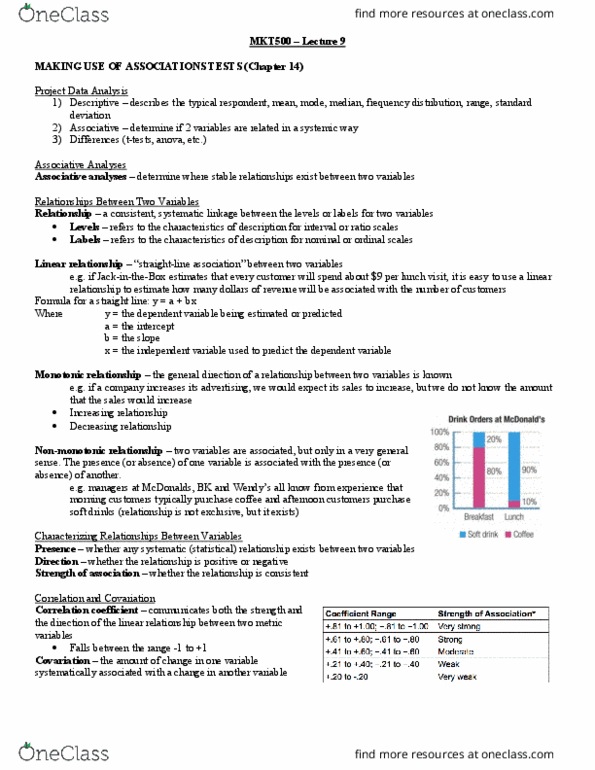
Increasing relationship (positive: decreasing relationship (negative, non-monotonic relationship: two variables are associated, but only in a very general sense. The presence (or absence) of one variable is associated with the presence (or absence) of another. Correlation analysis: assesses the strength of the association between two metric variables, or degree of covariation between two metric variables, covariation: the amount of change in one variable systematically associated with a change in another variable. If the correlation coefficient is statistically significant (i. e. p< 0. 05), the null hypothesis should be rejected and we assess the alternative hypothesis. If it is not significant, then it has no meaning. E. g. frequency table can be used to get a gender breakdown - analyse - descriptive stats - frequencies - drag gender - okay. Cross-tabulation table: types of numbers in each cell. Iv positioned as the column (e. g. gender: dv positioned as the row (e. g. usage)