MATH1041 Lecture Notes - Lecture 3: Logarithm, Linear Map

1 Aug 2018
School
Department
Course
Professor
Document Summary
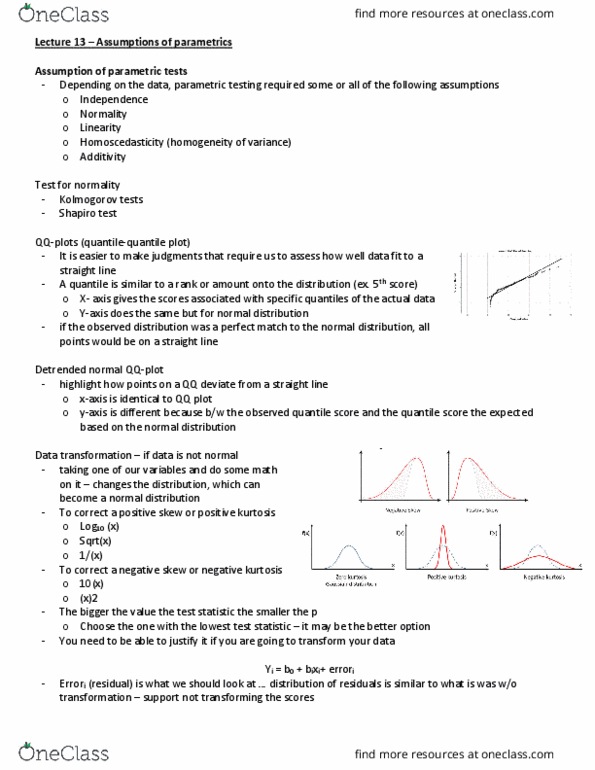
Wk2 lec 5 - 6 transformation and relationships between variables. Consider xnew as a function of the variable x (e. g xnew=x^2, xnew=log(x)) If xnew is a function of x, it is a transformation of x. There are 2 key types of transformation, linear and non-linear. E. g x^2 and 10log(x) is non-linear as it is a curve. 32+9x is linear as it is a straight line. Linear transformation changes the scale, leaves shapes unchanged. Used to convert or show a di erent scale (e. g degree to fahrenheit) Non-linear transformation changes the shape, good with handling strongly-skewed data and data with outliers. Concave (concave down) transformation pulls the large value down more than they pull the central/ small values. When your data takes positive values and is right skewed, these make it more symmetrical. They are in increasing order of strength and monotonically increasing. We apply log for e. g wealth, size, pro t, population, etc.