SCI1020 Lecture 11: Part 4c Inference a population proportion

22 Dec 2018
School
Department
Course
Professor
Document Summary
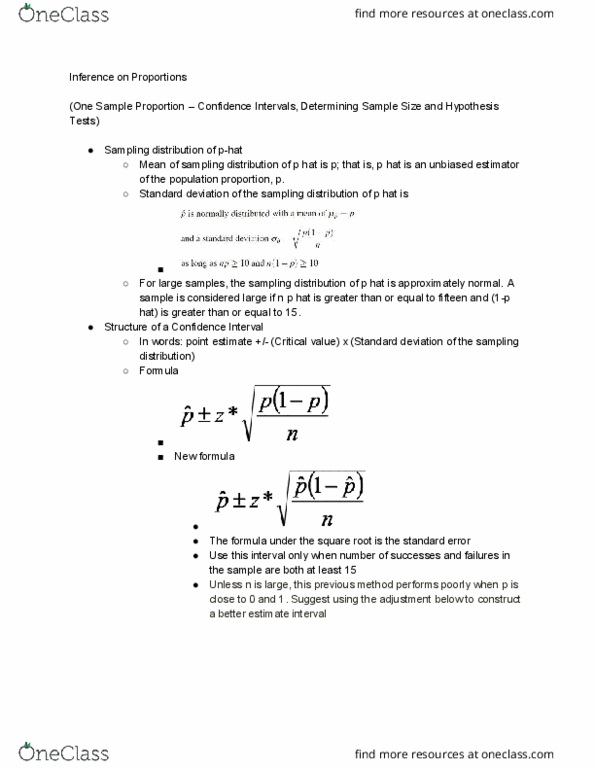
The proportion of a population that has some outcome or characteristic is represented. The proportion of this same outcome in a sample is measured by the sample proportion where x = number of that outcome in the sample, and n = total number of observations. The study has the variable in the form of a fraction of the sample (not a mean of value. 107 students in a sample of 130 students think . Scientists measured 125 koalas and found 68 of them to be . We need to know error in a p-hat. Standard error in a sample proportion is ted by the symbol: p rtion, symbol p-hat ions = sample size alues measured) e. g. , hat = 68/125 ith. This classical large scale version is limited as you must have at least 15 successes and 15 be accurate. When p hat is very low (below 10%) or very high (above 90%) it isn"t giving the most accu.