PSY3062 Lecture Notes - Lecture 8: Pearson Product-Moment Correlation Coefficient, Interval Ratio

25 Jun 2018
School
Department
Course
Professor

PSY3062 Lecture 8: Correlation
What is a correlation?
It is a statistical technique for measuring the extent to which two
variables are related
It measures the pattern of responses across variables
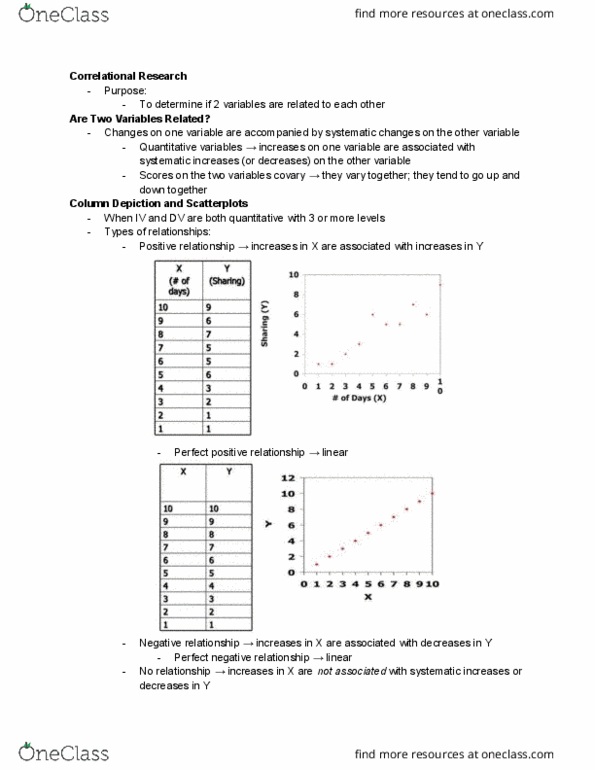
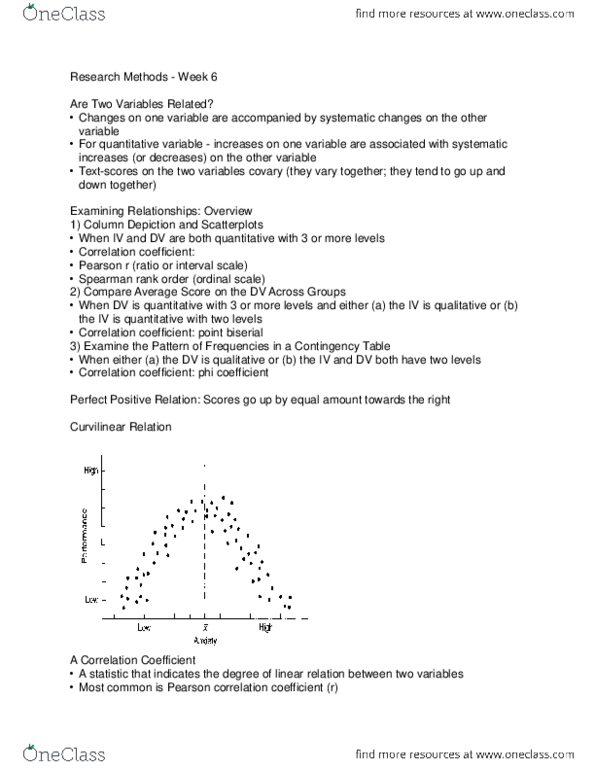
A relationship exists when changes in one variable tend to be
accompanied by consistent and predictable changes in the other variable
Assumes a linear relationship between two variables
Ranges from -1 to +1 (perfect negative, perfect positive)
- 0 indicates no relationship
The variance of a variable tells us how scores deviate from the mean
The covariance of two variables is similar to be variance, but tells us how
much scores on two variables differ from their means
Pearson Correlation
Measures the direction and degree of linear relationship between two
interval/ ratio variable
Pearson correlation assumption
Both variables measured on an interval or ratio scale
Both variable should be normally distributed
It measures the relationship between two ordinal variables; that is, X and
Y both consists of ranks
It measures the consistency of direction of relationship between two
interval/ ratio variables.
Assessment of the Relationship Strength
Use the coefficient of determination (r2)
Partial Correlation
- Measures the relationship between two variables, controlling for the
effect that a third variable is on
Semi-partial correlation
Pearson correlation
Spearman correlation
The directionality problem: it is not possible to determine which variable
is the cause, and which is the effect
- Lack of social support may increase risk
find more resources at oneclass.com
find more resources at oneclass.com
Document Summary
It is a statistical technique for measuring the extent to which two variables are related. It measures the pattern of responses across variables. A relationship exists when changes in one variable tend to be accompanied by consistent and predictable changes in the other variable. Assumes a linear relationship between two variables. Ranges from -1 to +1 (perfect negative, perfect positive) The variance of a variable tells us how scores deviate from the mean. The covariance of two variables is similar to be variance, but tells us how much scores on two variables differ from their means. Measures the direction and degree of linear relationship between two interval/ ratio variable. Both variables measured on an interval or ratio scale. It measures the relationship between two ordinal variables; that is, x and. It measures the consistency of direction of relationship between two interval/ ratio variables. Measures the relationship between two variables, controlling for the effect that a third variable is on.