GENE20001 Lecture Notes - Lecture 23: Frequency Distribution, Overdominance, Twin Study

Document Summary
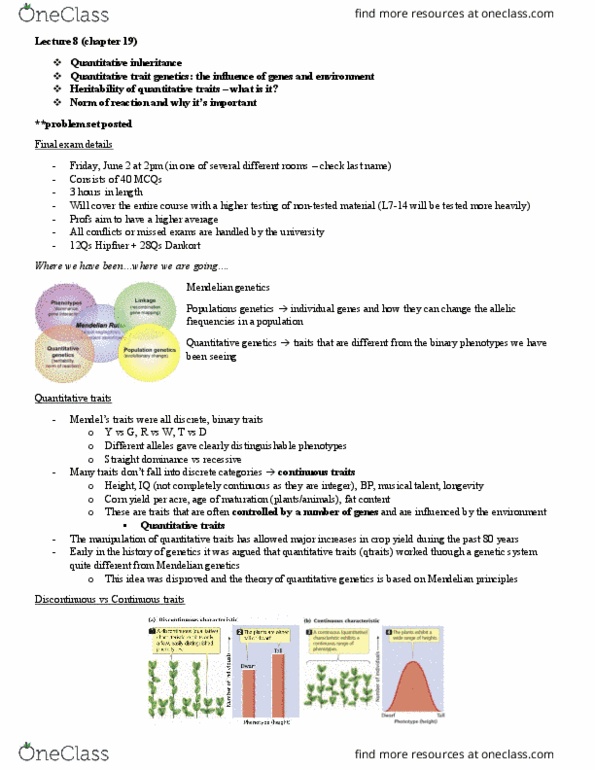
Quantitative traits are described by a frequency distribution and require precise measurement. Use of normal curves to describe the distribution of a trait in a population. As size of sample size increases distribution becomes more normal. Most traits controlled by many genes and the environment. As we go from a to pigment we get even more pink. Let"s say for the e1 enzyme one allele produces 10 units of pink. The other allele produces 50 units of pink. Max pigment = (50 + 25 + 40 + 35) x 2 = 300. Min pigment level = (10 + 5+ 10 + 25) x 2 = 100. Phenotypic distributions sum to produce a normal distribution with a single mode. If there are more genes and environment then you get smooth bumps in the distribution. Here there are two alleles a and a which control height. a/a doesn"t have one phenotype but a range. This is because the environment also affects height.