STAT150 Lecture Notes - Lecture 3: Bitcoin, Standard Deviation, Quartile

30 Aug 2018
School
Department
Course
Professor
Document Summary
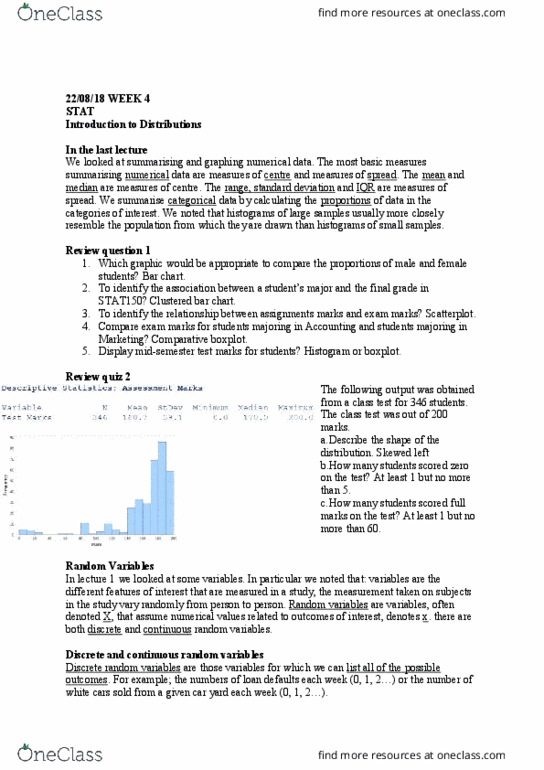
We considered various ways of summarising and graphing data. Bar charts and pie charts are used to display categorical variable. Frequency tables are used to summarise a categorical variable. Clustered bar charts are used to display the association between two categorical variables. Contingency tables are used to summarise two categorical variables. Histograms are used to display a numerical variable. The mean and median describe the centre of a numerical variable. The range, iqr, and standard deviation describe the spread of that variable. Describing the centre and the spread of distributions. Last week we discussed two measures of centre (mean, median) and three measures of spread (range, iqr, standard deviation). That all depends on the shape of the distribution. The median divides the area in the distribution into two equal parts. The mean is the centre of gravity (point of balance) of the data.