ECON111 Lecture Notes - Lecture 3: Marginal Cost, Demand Curve, Opportunity Cost


Demand and Supply
A market has two sides: buyers and sellers. In a competitive market, where there are many buyers
and many sellers, no single player can influence price.
In this demand and supply model, we study relative price, not money price. i.e. when we say that a
price will fall, it means that it will become relatively cheaper to other products.
Demand
Demand reflects a decision about which wants to satisfy. It entails that the buyer wants the product,
can afford the product, and plans to buy the product. Ma fators ifluee a uers demand, in
including price, quality, income, personal tastes, convenience, and customer service.
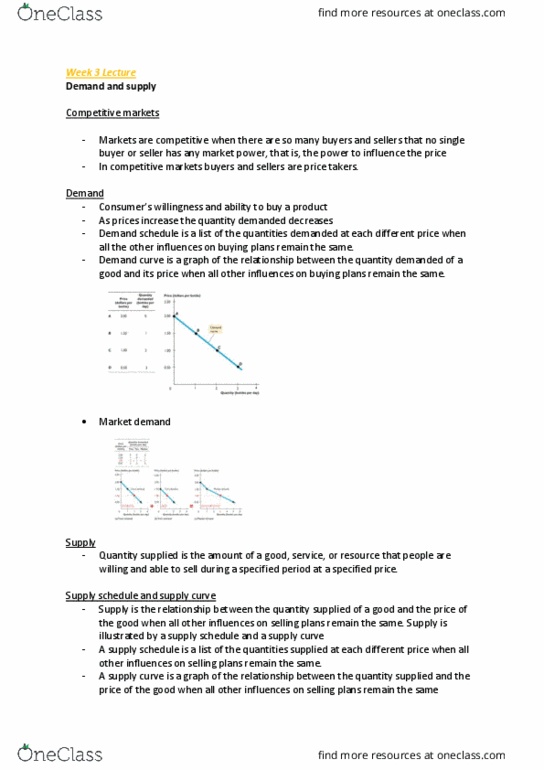
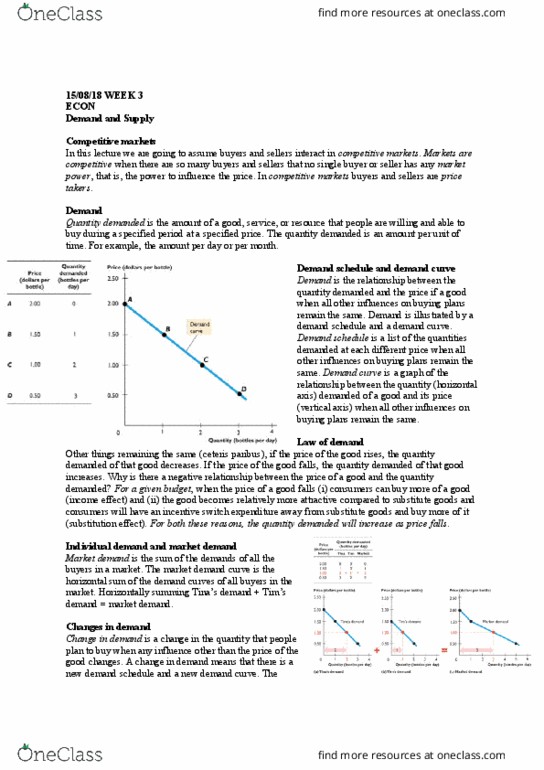
The real list is endless, but we will construct a model of demand as a function of price. Because of
the law of demand, we understand that there is a negative / inverse relationship between the price
and the quantity demanded. Hence the demand curve is a downward sloping graph.
The models use smooth curve or straight line, but the real world data might be more jagged. But it
still follows the same downward sloping relationship. This relationship exists for two reasons:
• The substitution effect – Although each good it unique, it does have substitutes. When
prices increase, other products become relatively cheaper and the opportunity cost rises. So,
the incentive to save and switch to a substitute becomes stronger, reducing demand.
• Income effect – Real income reduces when the prices increase, so buyers cannot afford to
consume as much as before. They must decrease consumption, reducing demand.
When some influence on buying plans other than the price of the good changes, there is a change in
demand for that good. These factors are:
• The prices of related goods:
o The price of substitutes is positively related to demand. When the price of a
substitute increases, demand increases, and vice versa.
o The price of a complement in inversely related to demand. When the price of a
complement increases, demand decreases, and vice versa.
• Expected future prices: If expected future prices increase, current demand increases.
find more resources at oneclass.com
find more resources at oneclass.com

• Income: when income increases consumers buy more of normal goods (increasing demand)
and less of inferior goods (decreasing demand).
• Expected future income and credit: When expected future income increases or when credit
is easy to obtain, the demand might increase now
• Population: the demand curve represents the market demand, hence the larger the
population, the greater is the demand for all goods.
• Preferences: If there is a shift in preferences towards a good, maybe because of a successful
marketing campaign, the demand for the good increases.
The quantity of the good that people plan to buy changes at each and every price because of these
factors, so there is a new demand curve. When demand increases the curve shifts right, and vice-
versa.
smaller the quantity available, the higher is the price that someone is willing to pay for another unit
Supply
Supply requires that the seller has the resources to produce it, can profit from producing it, and
plans to produce and sell it. Resources and technology are constraints that limit what is possible to
produce. Moreover, many useful things could be produced and supplied, but they are usually not by
firms unless it is possible to profit from doing so.
In our model of supply, quantity supply is a function of price, where the variables are positively
related. As the price goes up, the quantity supplied tends to go up, and vice-versa. This is because
firms sell only if the prices cover their marginal cost of production, and marginal cost increases when
quantity supplied increases. So the price must also increase for the quantity supplied to increase.
find more resources at oneclass.com
find more resources at oneclass.com
Document Summary
A market has two sides: buyers and sellers. In a competitive market, where there are many buyers and many sellers, no single player can influence price. In this demand and supply model, we study relative price, not money price. i. e. when we say that a price will fall, it means that it will become relatively cheaper to other products. Demand reflects a decision about which wants to satisfy. It entails that the buyer wants the product, can afford the product, and plans to buy the product. Ma(cid:374)(cid:455) fa(cid:272)tors i(cid:374)flue(cid:374)(cid:272)e a (cid:271)u(cid:455)er(cid:859)s demand, in including price, quality, income, personal tastes, convenience, and customer service. The real list is endless, but we will construct a model of demand as a function of price. Because of the law of demand, we understand that there is a negative / inverse relationship between the price and the quantity demanded. Hence the demand curve is a downward sloping graph.