1305AFE Lecture Notes - Lecture 11: Coefficient Of Determination, Total Variation, Test Statistic


Week 11 Business Data Analysis Lecture Notes
Topic 10: Simple Linear Regression
Introduction
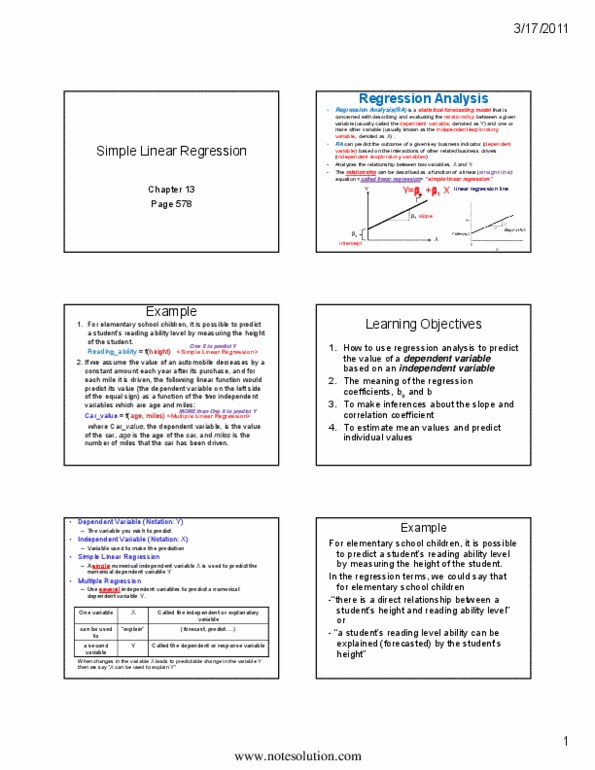
• When the problem objective is to analyze the relationship between numerical
variables, correlation and regression analysis is the first tool we will study.
• Regression analysis is used to predict the value of one variable (the dependent
variable) on the basis of other variables (the independent variables).
o Dependent variable: denoted Y
o Independent variables: denoted X
A model
• A model of the relationship between house size (independent variable) and house
price (dependent variable) would be:
• In real life, however, the house cost will vary even among the same size of house:
find more resources at oneclass.com
find more resources at oneclass.com

Random Term
• We now represent the price of a house as a function of its size in this probabilistic
model:
o y = 300 000 + 800x +
• where (Greek letter epsilon) is the random term (also known as error variable).
• It is the difference between the actual selling price and the estimated price based on
the size of the house.
• Its value will vary from house sale to house sale, even if the area of the house (i.e. x)
remains the same due to other factors such as the location, age, décor etc of the
house.
Model
• A straight-line model with one independent variable is called a simple linear
regression model. It is written as:
Simple Linear regression model
find more resources at oneclass.com
find more resources at oneclass.com

Estimating the coefficients
• In much the same way we base estimates of µ on
, we estimate 0 using
and 1
using
, the y-intercept and slope (respectively) of the least squares or regression
line given by:
• (Recall: this is an application of the least squares method and it produces a straight
line that minimizes the sum of the squared differences between the points and the
line)
Least squares method
• The question is:
o Which straight line fits best?
o The least squares line minimizes the sum of squared difference between the
points and the line
Example 1
x
ˆˆ
y
ˆ
10
bb
+=
find more resources at oneclass.com
find more resources at oneclass.com
Document Summary
A model: a model of the relationship between house size (independent variable) and house price (dependent variable) would be: In real life, however, the house cost will vary even among the same size of house: It is the difference between the actual selling price and the estimated price based on the size of the house. Its value will vary from house sale to house sale, even if the area of the house (i. e. x) remains the same due to other factors such as the location, age, d cor etc of the house. Model: a straight-line model with one independent variable is called a simple linear regression model. Least squares method: the question is, which straight line fits best, the least squares line minimizes the sum of squared difference between the points and the line. Least square estimates: to calculate the estimates of the coefficients that minimise the differences between the data points and the line, use the formulas: s.