MIS171 Lecture Notes - Lecture 4: Percentile, Point Estimation, Statistical Parameter

Document Summary
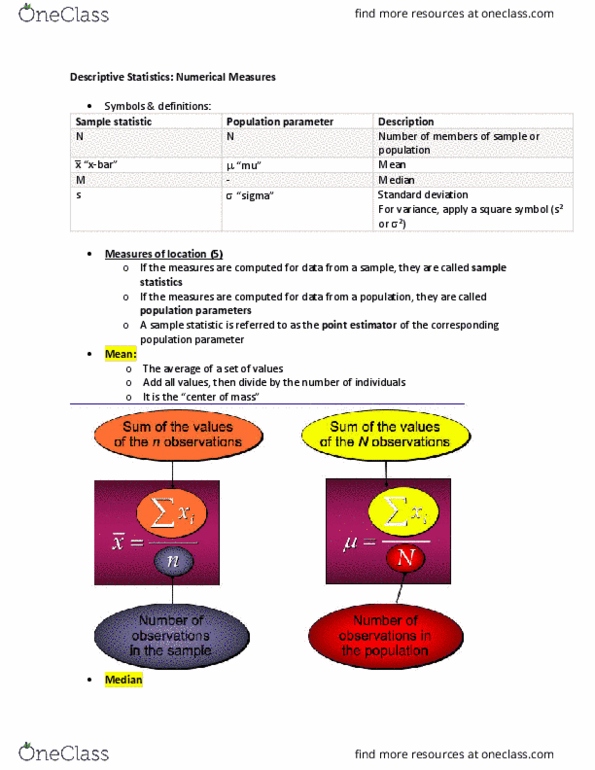
A sample statistic is a point estimator of the corresponding population parameter. Detected visually or by calculated outlier ranges: mean: average, median: middle value (must be arranged in ascending order, mode: most common value. The median is the preferred measure of central tendency as outliers can inflate or deflate the mean (average) making it a less accurate measure. The mode can occur at two or more different values. If the data has exactly 2 modes, the data are. Any more than 2 modes and its multimodal. Quartiles are specific percentiles that are commonly used: first quartile , second quartile , third quartile , minimum, maximum. Describes the spread or the dispersion of the data set. Gives a more complete numerical description of the data. Range: the range of the data is the difference between the largest and the smallest set of data, maximum minimum = range, the simplest measure of variability, very sensitive to the smallest and largest data values.