EHR519 Lecture Notes - Lecture 2: Bundle Branch Block, Left Ventricular Hypertrophy, Atrial Flutter


1. Week 2: CVD – Pathophysiology of Cardiovascular
Disease: Heart Mechanisms (Part A)
Introduction
Many cardiac conditions have underlying abnormality in the electrical conduction pathway
Some of these are normal and not limiting to exercise, while others are abnormal and potentially limiting
for exercise
It is essential for the Accredited Exercise Physiologist (AEP) to understand what a “normal” 12-lead
electrocardiogram (ECG) trace looks like
This allows the AEP to identify abnormal aspects of a trace, thereby permitting identification of abnormal
cardiac function
It is routine in AEP clinical practice for a resting 12-lead ECG to be acquired prior to stress testing
Basic trace analysis permits the AEP to progress from rest to the stress test if no concerning abnormalities
are present
During the stress test a general practitioner will supervise (normally towards the end) to decipher test
termination
While the AEP cannot diagnose, and shouldn’t be relied upon a fully supervise a stress test – it is
important that the AEP can correctly identify concerning conduction pathway abnormalities and be able
to call on the supervising doctor as appropriate. Common and/or important cardiac conditions include:
Left ventricular hypertrophy
Atrial hypertrophy
Premature ventricular contractions
Premature atrial contractions
Atrial fibrillation and atrial flutter
Atrioventricular blocks
Bundle branch blocks
ST-segment depression, elevation and Q-waves
12-leas ECG electrode placement
find more resources at oneclass.com
find more resources at oneclass.com

Rules of a normal ECG
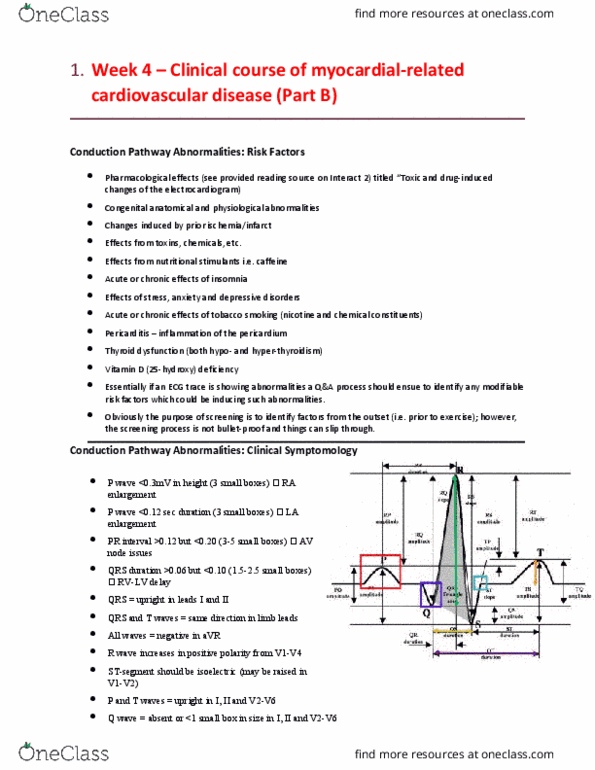
P wave <0.3mV in height (3 small boxes) RA enlargement
P wave <0.12 sec duration (3 small boxes) LA enlargement
PR interval >0.12 but <0.20 sec (3-5 small boxes) AV node issues
QRS duration >0.06 but <0.10 (1.5-2.5 small boxes) RV-LV delay
ST-segment should be isoelectric (may be raised in V1-V2)
Q wave = absent or <1 small box in size in I, II, and V2-V6
find more resources at oneclass.com
find more resources at oneclass.com

QRS = upright in leads I and II
QRS and T waves = same direction in limb leads (same direction as each other)
All waves = negative in aVR
R wave must increase from V1-V4
P-waves = upright in I, II and V2-V6
T wave = upright in I, II and V2-V6
Basic 12-lead ECG trace analysis
Heart rate – heart rate refers to the number of cardiac cycles (beats) the heart completes in a given
amount of time. Normally, the HR is expressed as the number of beats per minute (bpm). The HR can be
estimated by simply dividing 1500 by the number of small squares (1mm) between successive R waves.
Any lead can be used for this analysis. For this method, 27 small squares between R waves would equate
to a HR of approximately 55bpm (1500/27=55). Normal rate is between 60-100 bpm.
Bradycardia: HR is less than 60 beats/min
Tachycardia: HE is greater than 100 beats/min
Heart Rhythm – The heart rhythm refers to two aspects of the heart: 1) the site from which the impulse
has originated, and 2) the tempo of the contractions (regularity of the heart beats). The first aspect of the
heart rhythm is determined by looking at any lead for the presence of a P wave. The second aspect of
find more resources at oneclass.com
find more resources at oneclass.com
Document Summary
Week 2: cvd pathophysiology of cardiovascular. Many cardiac conditions have underlying abnormality in the electrical conduction pathway. Some of these are normal and not limiting to exercise, while others are abnormal and potentially limiting for exercise. It is essential for the accredited exercise physiologist (aep) to understand what a normal 12-lead electrocardiogram (ecg) trace looks like. This allows the aep to identify abnormal aspects of a trace, thereby permitting identification of abnormal cardiac function. It is routine in aep clinical practice for a resting 12-lead ecg to be acquired prior to stress testing. Basic trace analysis permits the aep to progress from rest to the stress test if no concerning abnormalities are present. During the stress test a general practitioner will supervise (normally towards the end) to decipher test termination. P wave <0. 3mv in height (3 small boxes) ra enlargement. P wave <0. 12 sec duration (3 small boxes) la enlargement.