MATH 2510 Chapter Notes - Chapter 2: Cumulative Frequency Analysis, Upper Class, Ogive

5 Sep 2018
School
Department
Course
Professor
Document Summary
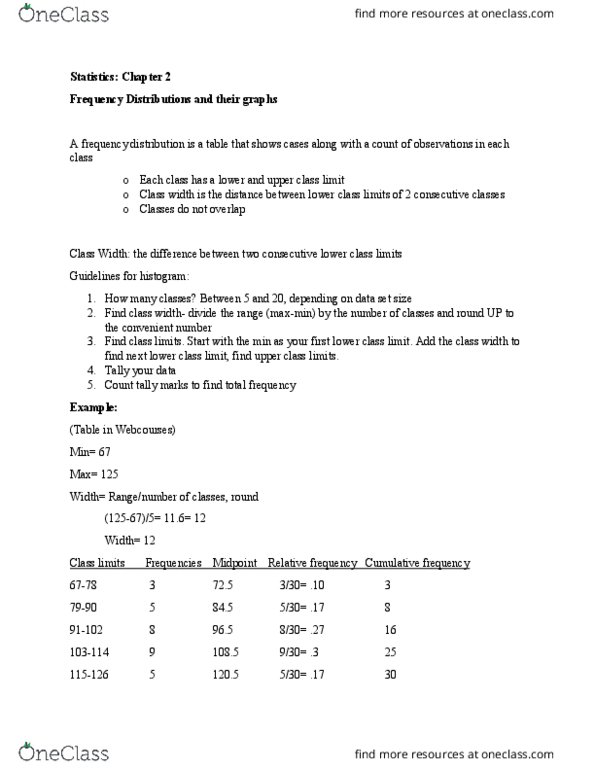
Frequency tables- organizes data into classes of equal width (histograms and bar graphs) How to find class width: (largest data value-largest data value)/desired number of classes. Note: even if the answer is a whole number, you must round up to the next whole number. Upper class limit: highest value that can fit in a class. Class width: the difference between 2 consecutive lower class limits for the two classes right next to each other. Formula to find it: (lower + upper class limit)/2. Class boundaries: the halfway points on the intervals that separate classes. Note: relative frequency histograms show percentage of the sample for the units. Uniform (all bars are same size so it just looks like a big rectangle) Skewed left/right (it is skewed in the same direction as where the tail leads) Bimodal (2 mountains)(may indicate data from 2 different populations) Cumulative frequency- the sum of frequencies over the lower classes.