PSYC 1010 Chapter Notes - Chapter 2: Frequency Distribution, Histogram

20 Nov 2017
School
Department
Course
Professor


63
PSYC 1010 Full Course Notes
Verified Note
63 documents
Document Summary
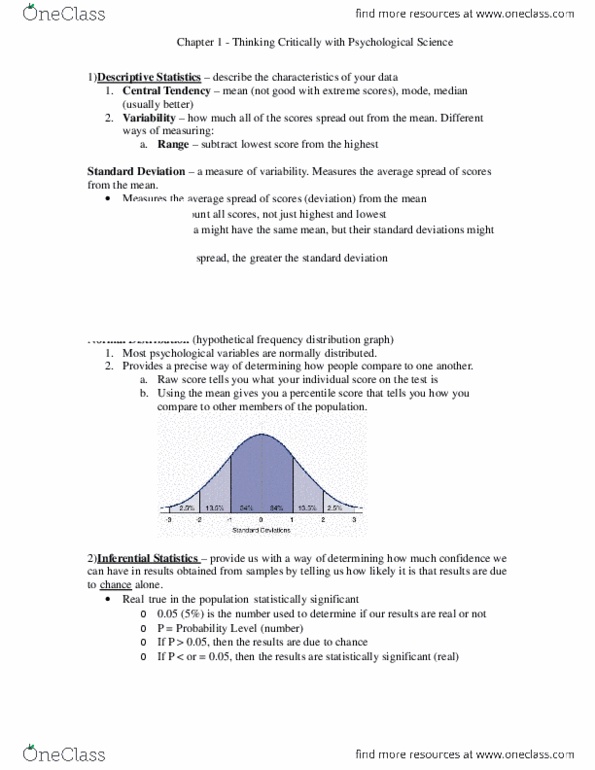
Statistics is the use of mathematics to organize, summarize, and interpret numerical data. Histogram a bar graph that presents the data from a frequency distribution. Frequency polygon a line figure used to present data from a frequency distribution. (is derived from the histogram) There are two types of statistics: descriptive statistics, inferential statistics, descriptive statistics: Allows you to summarize and describe the characteristics of your scores using: (b) variability (a) measures of central tendency: Includes values such as the mean, median, and mode. Median = 60% (the value that"s in the middle of the data) Mean = 58% (the average of all the data) Mode = 80% (the value that occurs most frequently) (b) variability: Describes how much the scores are spread out from the mean.