BU486 Chapter Notes - Chapter 3: Data Flow Diagram, Business Process, Flowchart


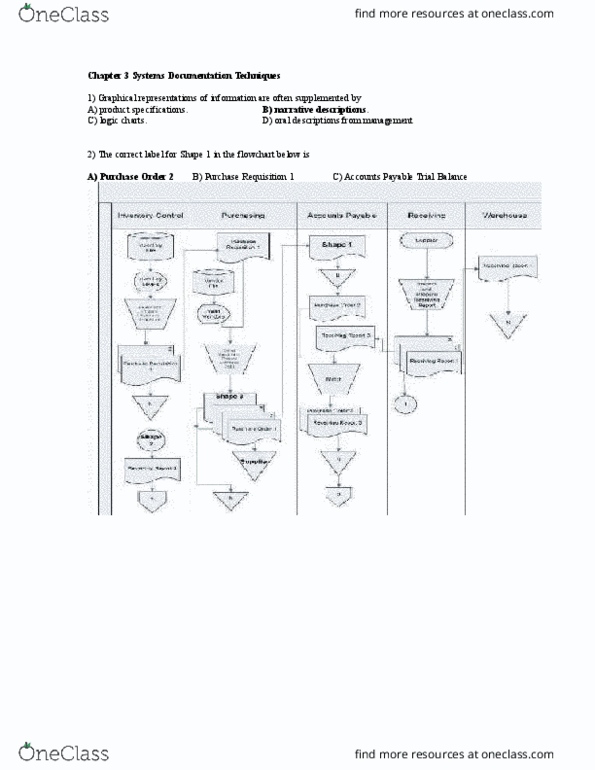
Chapter 3 – Systems Documentation Techniques
Data flow diagram (DFD) – graphical description of the flow of data within an organization
• Processes
• Sources and destinations of the data
• Data stores
Data source – entity that produces or sends the data that is entered into a system
Data destination – entity that receives data produced by a system
Data flow – movement of data among processes, stores, sources, and destinations
Why Document Systems?
• Accountants must be able to read documentation and understand how a system works, e.g. auditors
need this
• Sarbanes Oxley act requires management to assess internal controls and auditors to evaluate the
assessment
• Used for systems development and changes
Flowcharts – describe an information system showing:
• Inputs and outputs
• Information activities
• Data storage
• Data flows
• Decision steps
Types of flow charts
1. Document flowcharts – shows the flow of documents and data for a process, useful for auditors
2. System flowcharts – depicts the data processing cycle for a process
3. Program flowcharts – illustrates the sequence of logic in the system process
Guidelines for Drawing Flowcharts
• Understand the system you are trying to represent
• Identify business processes, documents, data flows, and data processing procedures
• Organize the flowchart so as it reads from top to bottom and left to right
• Clearly label all symbols
• Use page connectors
• Edit, review, refine to make it easy to read and understand
Business process diagrams (BPD) – represents the activities in a business process, users understands the
process from a standard notation, shows the organizational unit performing the activity
Guidelines for Drawing Data Flow Diagrams
• Identify and understand the business process
• Decide the level of detail (summary or detailed DFD)
• Organize diagram using as many rows needed to explain the process
find more resources at oneclass.com
find more resources at oneclass.com
Document Summary
Data flow diagram (dfd) graphical description of the flow of data within an organization: processes, sources and destinations of the data, data stores. Data source entity that produces or sends the data that is entered into a system. Data destination entity that receives data produced by a system. Data flow movement of data among processes, stores, sources, and destinations. Why document systems: accountants must be able to read documentation and understand how a system works, e. g. auditors need this, sarbanes oxley act requires management to assess internal controls and auditors to evaluate the assessment. Information activities: used for systems development and changes. Flowcharts describe an information system showing: data storage, data flows, decision steps. Business process diagrams (bpd) represents the activities in a business process, users understands the process from a standard notation, shows the organizational unit performing the activity.