PSYC 1010 Chapter Notes - Chapter 4: Squared Deviations From The Mean, Square Root, Standard Deviation

Document Summary
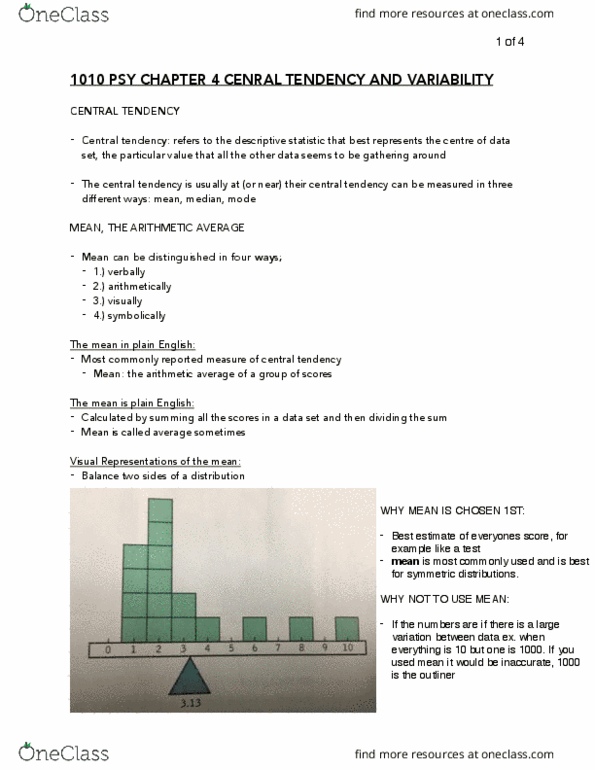
The descriptive statistic that best represents the center of a data set, the particular. Central tendency value that all the other data seem to be gathered around. Usually at or near the highest point in a histogram or polygon. Can be measured in three different ways: One of the most important ways to understand a distribution of data. The arithmetic average of a group of scores. Calculated by summing all the scores and dividing by the total number of scores. Divide the sum of all scores by the total number of scores. Mean of a sample: m or x (with line over top- x bar) X- used to indicate the total of x"s (scores) in a sample. Step 1: add up all of the scores in the sample= x. Step 2: divide the sum of all of the scores by the total number of scores. Equation for sample mean: m= x / n.