STAT151 Chapter Notes - Chapter 3: Histogram, Unimodality, Frequency (Statistics)

30 Mar 2016
School
Department
Course
Professor


4
STAT151 Full Course Notes
Verified Note
4 documents
Document Summary
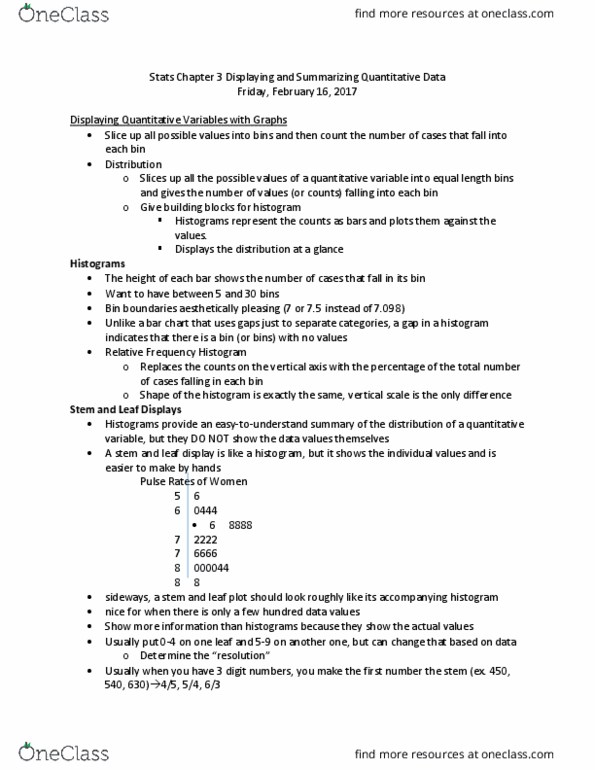
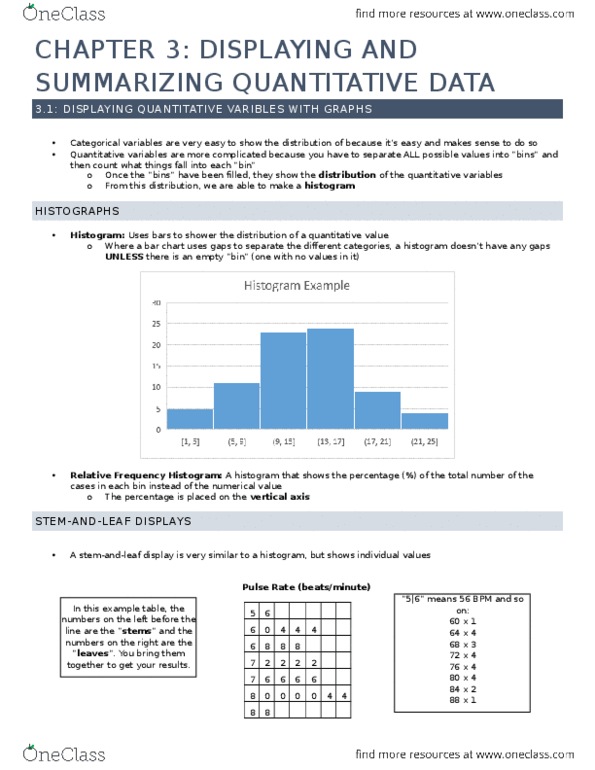
Plots bin counts (separaing variables into equal width piles) as the heights of the bars. From this histogram, we can see that most of the values are concentrated around 80, and that the values range from 0 to. Displays the percentage of cases in each bin instead of a count. Show distribuion of data while preserving individual values. To construct a stem-and-leaf display: cut each data into stems and leaves (e. g for the number 12, 1 is the stem and 2 is the leaf: use the stem to label the bins, use only one digit for each leaf (round or truncate data value if needed) A graph that has a dot along an axis for each case in the data. Values of quanitaive variable whose units are know. You need to check this before making a stem-and-leaf display, histogram or a dotplot. Talking about the shape, centre and spread of a distribuion: