BUEC 232 Chapter Notes - Chapter 2: Quality Management, Pie Chart, Ogive

13 Oct 2016
School
Department
Course
Professor


16
BUEC 232 Full Course Notes
Verified Note
16 documents
Document Summary
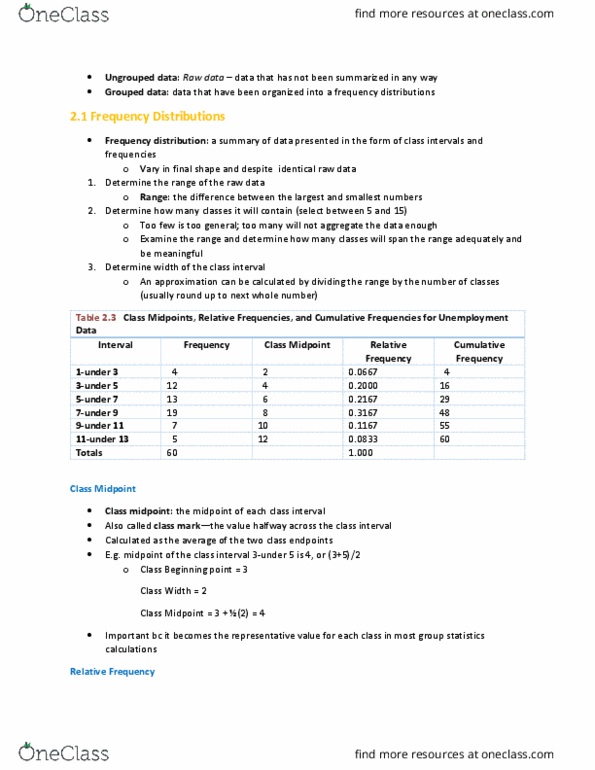
Frequency distribution: summary of data presented as class intervals/frequencies: first determine range of raw data. Range: difference between largest and smallest numbers: next determine how many classes it will contain. Too few is too general to be useful. Too (cid:373)a(cid:374)y does(cid:374)"t aggregate data e(cid:374)ough to be helpful: next determine width of class interval. Approx. width by dividing range by # of classes. Frequency distribution must start at value equal/lower than lowest # Class midpoint: midpoint of each class interval: aka class mark, value halfway across the class interval, calculated as the average of two class endpoints, become representative value for each class in most group stat calculation. Relative frequency: proportion of total frequency that is in any given class interval in a frequency distribution. Cumulative frequency: running total of frequencies through classes of freq. distribution: added to the preceding cumulative total, cumulated sales, sport scores, years of service, points earned in a course.