ITM 410 Chapter Notes - Chapter 4: Information Processing, Flowchart, Data Flow Diagram

5 Feb 2015
School
Department
Course
Professor
Document Summary
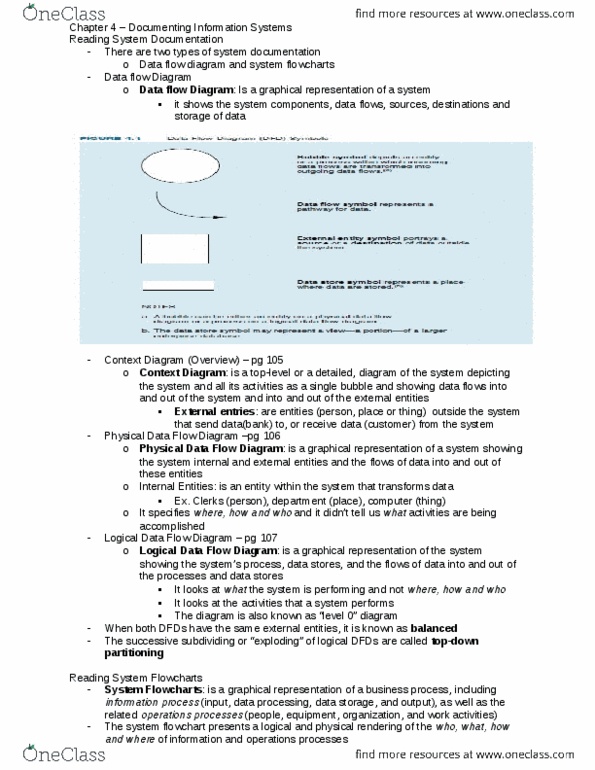
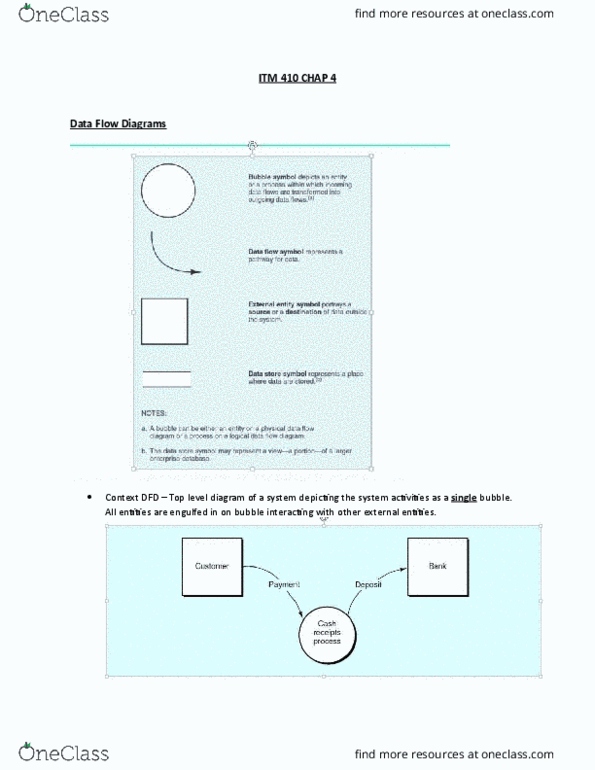
Refer to figure 4. 1 for data flow diagram (dfd) symbols on pg 104. Data flow diagram (dfd) is a graphical representation of a system: it depicts a system"s components, the data flows among the components & the sources, destinations & storage of data. Refer to figure 4. 3 on pg 106 and read the example. We can concentrate on the activities that a system performs (what the system performs instead of trying to figure out how, where or by whom) Refer to figure 4. 4 on pg 107. Logical dfds are also known as level 0 diagram. When the context & level 0 diagrams have equivalent external data flows, then dfds are balanced. Refer to figure 4. 5 on pg 109 & read the example on pg 108. Refer to figure 4. 6 on pg 110 which shows the systems flowcharting symbols. Refer to figure 4. 7 on pgs 111-114 which contains routines often found on systems flowcharts.