ECN 104 Chapter Notes - Chapter 2: Demand Curve, Scatter Plot, Bar Chart

14 Oct 2015
School
Department
Course
Professor
Document Summary
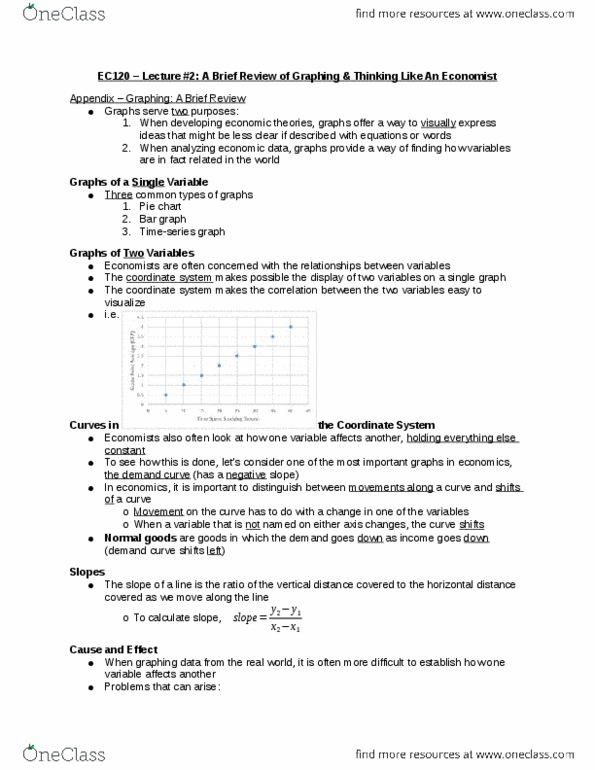
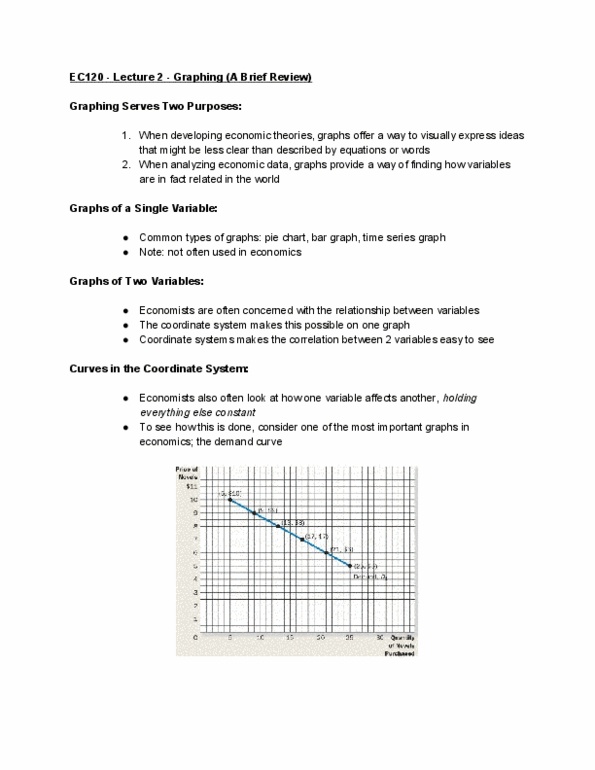
Three common types of graphs: pie chart in panel, bar graph in panel, time-series graph. It is a negative slope negatively related; positive slope positively related. If her income rises to 000/year, she buys more novels, her demand curve shifts to d2 (values from right- hand column of the table). Emma"s demand curve for novels shifts to the right when her income increases. If her income falls to 000/year, she buys less novels, her demand curve shifts to d3 (values from left- hand column of the table). Emma"s demand curve for novels shifts to the left when her income decreases. In economics, it is important to distinguish between movements along a curve and shifts of a curve. If emma earns 000 per year and novels cost a piece, she will purchase. If the price of novels falls to , emma will increase her purchases of novels to 17 per year (d1).