21642 Chapter Notes - Chapter 9: Scatter Plot, Basis Point, Regression Analysis

13 Jun 2018
School
Department
Course
Professor

Cost Behaviour and Cost Volume Profit Analysis
Total Cost = Fixed Cost + (Unit Variable Cost x Quantity)
Sales = Fixed Costs + Variable Costs + Profit
Semi-variable costs - costs that have both a fixed and variable component e.g. electricity fixed for
lighting purposes but variable for production purposes.
Cost-volume relation - cost is expected to increase an volume increases.
Techniques used to derive cost function from volume and costs data:
-Scatter diagram
-High-low method
-Regression analysis
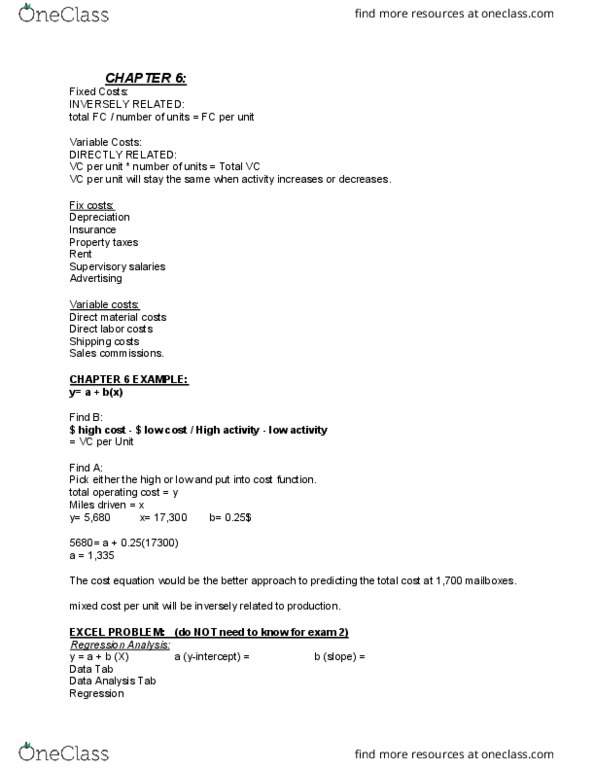
High-Low Method - Substratct lowest cost from the highest cost:
-TC = FC + (VC x Q), or
-y = a + bx
-(a + intercept of y-axis, b + slope of line, x = quantity)
Example:
Determining Variable Costs:
Determining Fixed Costs:
1. Total Cost = FC + VC x Q
2. 1,000 = FC + 1 x 500
3. FC = 500
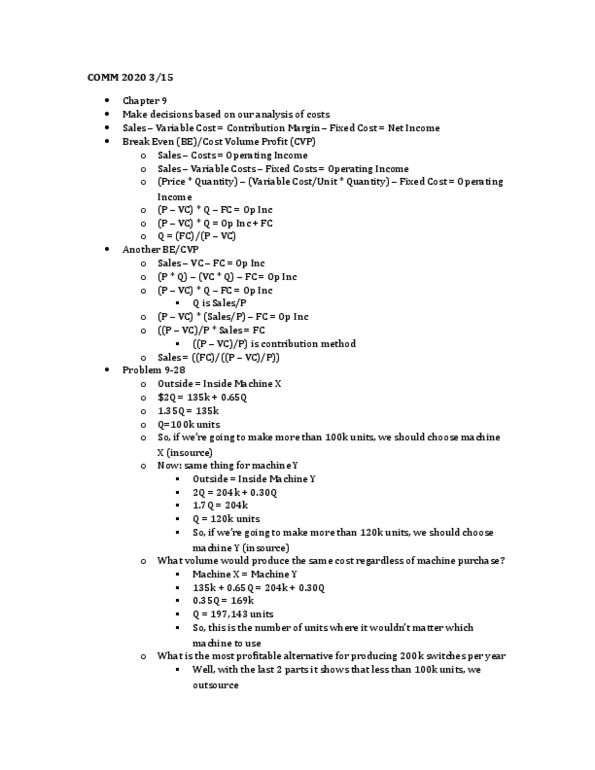
Cost Volume Profit (CVP) Relation:
-Total Revenue (TR) = Price x Quantity
-Total Cost (TC) = Fixed Cost + Variable Costs x Quantity
-TR = TC + Profit : (P x Q) = (FC + VC x Q) + Profit
-Break-even point: Profit = 0 (not positive or negative)
Contribution Per Unit - the difference between the revenue per unit and the variable cost per unit.
Marginal Cost - the addition to total cost which will be incurred by producing one more unit of
output.
Operating Gearing - the relationship between the total fixed and the total variable cost for some
activity.
Weaknesses of break-even analysis:
•Non-linear relationships - assumes relationships between revenue, variable costs and volume
are linear, which is unrealistic
•Stepped fixed costs - most fixed costs are not constant, but are stepped
find more resources at oneclass.com
find more resources at oneclass.com
Document Summary
Total cost = fixed cost + (unit variable cost x quantity) Sales = fixed costs + variable costs + pro t. Semi-variable costs - costs that have both a xed and variable component e. g. electricity xed for lighting purposes but variable for production purposes. Cost-volume relation - cost is expected to increase an volume increases. Techniques used to derive cost function from volume and costs data: High-low method - substratct lowest cost from the highest cost: Tc = fc + (vc x q), or. (a + intercept of y-axis, b + slope of line, x = quantity) Determining fixed costs: total cost = fc + vc x q, 1,000 = fc + 1 x 500, fc = 500. Total revenue (tr) = price x quantity. Total cost (tc) = fixed cost + variable costs x quantity. Tr = tc + pro t : (p x q) = (fc + vc x q) + pro t.