7126 Chapter Notes - Chapter MODULE 2B: Heteroscedasticity, Sample Size Determination, Statistical Power

20 Jun 2018
School
Department
Course
Professor

CORRELATION
Covariation
- Some things are connected to other things
- We look at degree of relationship between different phenomena
- Covariations are the basis of more complex models
Purpose of correlations
- Purpose
oThe underlying purpose is to help address the questions
What is the
Relationship, association, shared variance or re-relation between
two variables
oOther ways of expressing the underlying correlational questions include
to what extent do variables covary, depend on another and explain the
other
Linear correlation
- extent to which two variables have a simple linear (straight line) relationship
-
oCan use scatterplots
oShow that there is a relationship there somewhere
oThe linear relatin between two variables is indicated by a correlation
Direction: sign +ve or -ve indicates direction of relationship
Strength: size indicates strength (closer to -1 or 1 indicate greater strength)
Statistical significance: p indicates likelihood that the observed relationship
could have occurred by chance
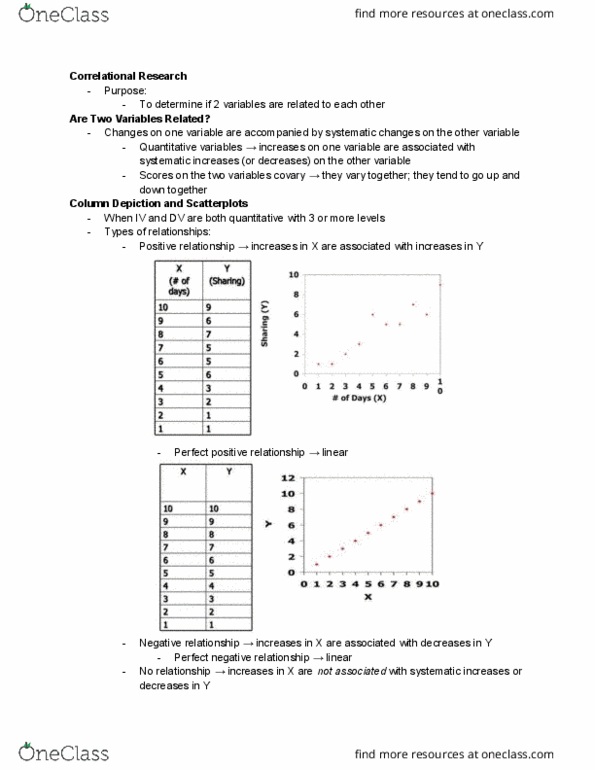
- Types of relationships
oNo relationship (r ~0)
find more resources at oneclass.com
find more resources at oneclass.com

x and y are independent
olinear relationship
x and y are dependent
as x increases so does y (r>0)
as x increases, y decreases (r<0)
onon linear relationship
Types of correlation
-
-
Nominal by nominal
- Contingency (or cross tab) tables
oObserved frequencies
find more resources at oneclass.com
find more resources at oneclass.com

oExpected frequencies
oRow and/or column %s
oMarginal totals
- Clustered bar chart
- Chi square
- Phi/Cramers V
- Contingency tables
oBivariate frequency tables
oMarginal totals (blue)
oObserved cell frequencies (red)
o
Combines frequencies for two different variables
oCell percentages
- Clustered bar chart
find more resources at oneclass.com
find more resources at oneclass.com