9
answers
1
watching
374
views

27 Jul 2023
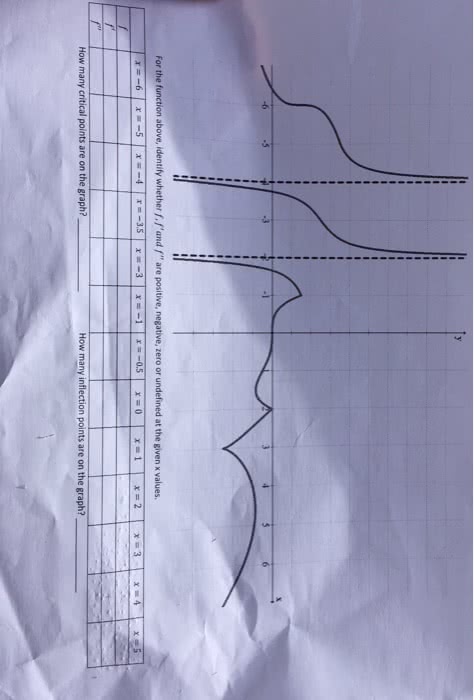
Below is the graph of a function y = f(x). Fill in the chart with POS, NEG or 0
to indicate whether f, f' and f" are positive, negative or zero at each of the indicated points A, B,C and D. (One point for each entry in first column and two points for each entry in 2nd and 3rd columns
Below is the graph of a function y = f(x). Fill in the chart with POS, NEG or 0
to indicate whether f, f' and f" are positive, negative or zero at each of the indicated points A, B,C and D. (One point for each entry in first column and two points for each entry in 2nd and 3rd columns


Read by 1 person

evangelistaLv10
12 Nov 2023
Already have an account? Log in
Read by 1 person

tanvir06205Lv2
1 Sep 2023
Already have an account? Log in
Read by 1 person

Read by 3 people

Read by 4 people

sarasafar552Lv2
31 Jul 2023
Already have an account? Log in
Read by 4 people

30 Jul 2023
Already have an account? Log in
Read by 4 people

Read by 6 people

padkfhus8wLv1
27 Jul 2023
Already have an account? Log in