13
answers
1
watching
348
views

12 Jan 2023
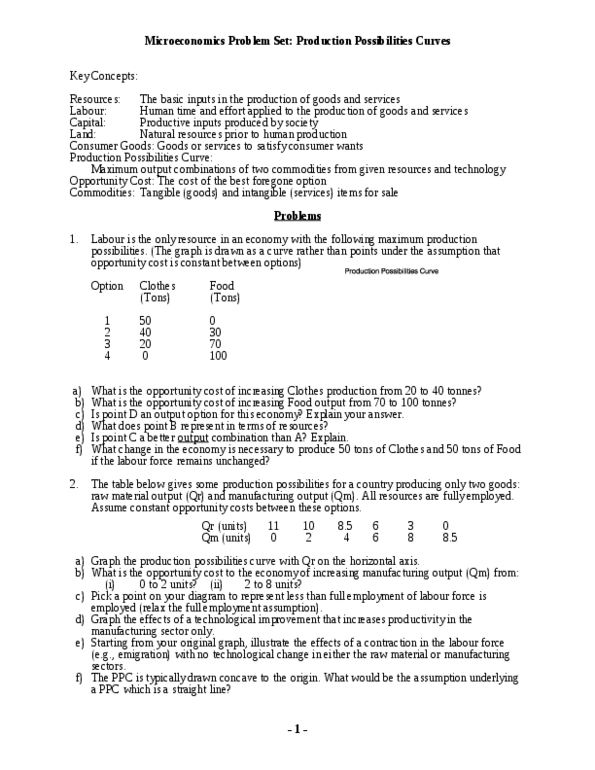
Which of the following best explains this graph?
- The graph provides a visual representation of how Hurdlandia shifted production from rice to automobiles over time.
- The graph illustrates how agriculture and industry compete for resources in Hurdlandia.
- The graph shows the growth of industry at the expense of agriculture in Hurdlandia.
- The graph shows annual amounts of Hurdlandia's two major imports.
- The graph shows the levels of production of Hurdlandia's two major exports

Read by 1 person

Read by 1 person

Read by 1 person

28 Jan 2023
Already have an account? Log in
Read by 1 person

15 Jan 2023
Already have an account? Log in
Read by 1 person

15 Jan 2023
Already have an account? Log in
Read by 1 person
Read by 1 person

Read by 1 person

Read by 1 person

Read by 1 person

grasyatottvLv4
13 Jan 2023
Already have an account? Log in
Read by 1 person

13 Jan 2023
Already have an account? Log in
Read by 1 person

Read by 1 person

gaitanfeutseLv1
13 Jan 2023
Already have an account? Log in