8
answers
0
watching
40
views
20 Nov 2019
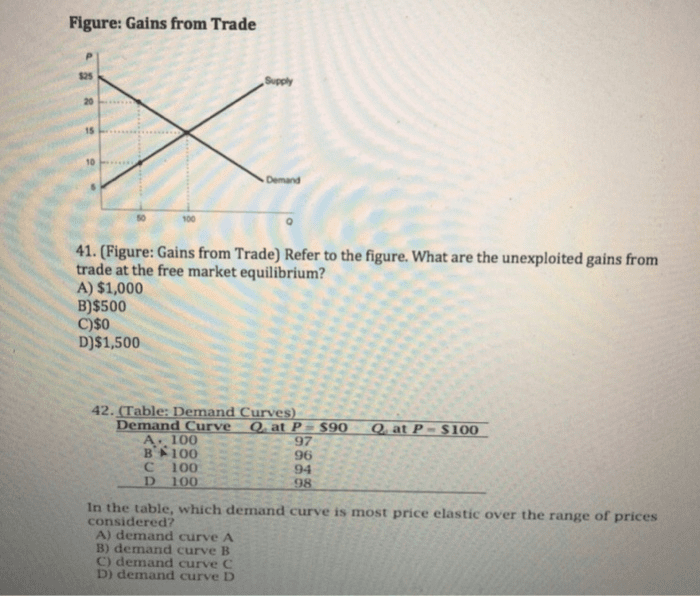
Figure: Gains from Trade s25 Supply 20 15 0 Demand so 100 41. (Figure: Gains from Trade) Refer to the figure. What are the unexploited gains frorm trade at the free market equilibrium? A) $1,000 B)$500 C)s0 D)$1,500 42. CTable: Demand Curves) nd Curve Q,at P590 Q at P-$100 A. Ä°00 B100 С 100 D 100 97 96 94 98 ã In the table, which demand curve is most price elastic over the range of prices considered? A) demand curve A B) demand curve B C) demand curve C D) demand curve D
evereadyLv10
11 Jun 2023
Unlock all answers
Get 1 free homework help answer.
Already have an account? Log in
OC4218648Lv10
11 Jun 2023
Get unlimited access
Already have an account? Log in
OC4396189Lv10
19 Apr 2023
Get unlimited access
Already have an account? Log in
eyuLv10
26 Mar 2023
Get unlimited access
Already have an account? Log in
yournotesbuddyLv10
26 Mar 2023
Get unlimited access
Already have an account? Log in
christopherc63Lv10
4 Nov 2022
Get unlimited access
Already have an account? Log in
coursetLv10
25 Sep 2022
Get unlimited access
Already have an account? Log in
Nelly StrackeLv2
27 Apr 2019
Get unlimited access
Already have an account? Log in