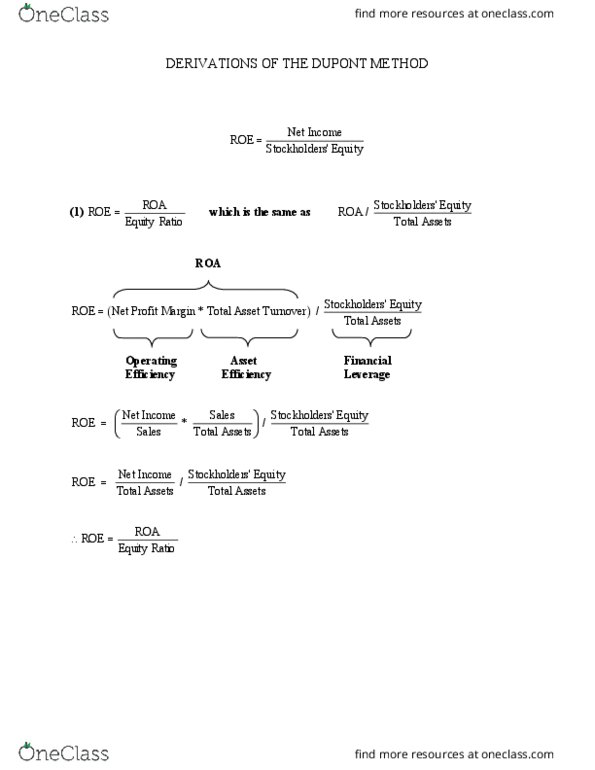
Suppose that an analyst has noticed that the return on equity of the XYZ Company has declined from 2012 to 2013. (millions) 2013 2012 Sales $1,000 $900 Earnings before interest and taxes $400 $380 Interest expense $30 $30 Taxes $100 $90 Total assets $2,000 $2,000 Shareholdersâ equity $1,250 $1,000 a. Fill in the following table (please show detailed calculations for each ratio, including the formula used, below that table): 2013 2012 Return on equity Return on assets Financial leverage ratio Total asset turnover Net profit margin Operating profit margin b. Using the DuPont formula, explain the source of this decline.
For unlimited access to Homework Help, a Homework+ subscription is required.
Related questions
Note:
This question has been answered totally from 1-8 questions in previuos requested, the only part ( need to answer ) I need to help me with that to have completed the calculations, provide a brief, two- to four-sentence rationale for how these calculations can be used in analyzing the financial position of a company and why they are important. Your rationale should explain what information the ratio provides to the reader and how the reader may use that information.
I will repeat tyoing the question for make it clearing .
Analysis of Financial Statements
Balance Sheets
EXHIBITS: INPUT DATA (XYZ)
Table 1 Balance Sheets
Assets | 2013E | 2012 | 2011 |
cash | $ 85,632 | $7,282 | $57,600 |
Acount Receivable | 878,000 | 632,160 | 351,200 |
Inventories | 1,716,480 | 1,287,360 | 715,200 |
Total current assets | $2,680,112 | $1,926,802 | $ 1,124,000 |
Gross fixed assets | 1,197,160 | 1,202,950 | 491,000 |
Less: accumulated depreciation | 380,120 | 263,160 | 146,200 |
Net fixed assets | $ 817,040 | $ 939,790 | $ 344,800 |
Total assets | $3,497,152 | $2,866,592 | $ 1,468,800 |
Liabilities and equity | |||
Accounts payable | $ 436,800 | $ 524,160 | $ 145,600 |
Notes payable | 300,000 | 636,808 | 200,000 |
Accruals | 408,000 | 489,600 | 136,000 |
Total current liabilities | $1,144,800 | $1,650,568 | $ 481,600 |
Long term bonds | 400,000 | 723,432 | 323,432 |
Total debt | $1,544,800 | $2,374,000 | $ 805,032 |
Common stock (100,000 shares) | 1,721,176 | 460,000 | 460,000 |
Retained earnings | 231,176 | 32,592 | 203,768 |
Total common equity | $1,952,352 | $ 492,592 | $ 663,768 |
Total liabilities and equity | $3,497,152 | $2,866,592 | $ 1,468,800 |
Analysis of Financial Statements
Income Statements
Table 2
Income Statements
2013E | 2012 | 2011 | |
Sales | $7,035,600 | $6,034,000 | $ 3,432,000 |
Cost of goods sold | 5,875,992 | 5,528,000 | 2,864,000 |
Other expenses | 550,000 | 519,988 | 358,672 |
Total operating exp. excl. depreciation and amortization | $6,425,992 | $6,047,988 | $ 3,222,672 |
EBITDA | $ 609,608 | $(13,988) | $ 209,328 |
Depreciation and amortization | 116,960 | 116,960 | 18,900 |
Earnings before interest and taxes (EBIT) | $492,648 | $(130,948) | $190,428 |
Interest expense | 70,008 | 136,012 | 43,828 |
Earnings before taxes (EBT) | $ 422,640 | $ (266,960) | $ 146,600 |
Taxes (40%) | 169,056 | (106,784) | 58,640 |
Net Income | $ 253,584 | $ (160,176) | $ 87,960 |
Earnings per share (EPS) | $ 1.014 | $ (1.602) | $ 0.880 |
Dividends per share (DPS) | $ 0.220 | $ 0.110 | $ 0.220 |
Book value per share (BVPS) | $ 7.809 | $ 4.926 | $ 6.638 |
Stock price | $ 12.17 | $ 2.25 | $ 8.50 |
Shares outstanding | 250,000 | 100,000 | 100,000 |
Tax rate | 40.00% | 40.00% | 40.00% |
Lease payments | $ 40,000 | $ 40,000 | $ 40,000 |
Sinking fund payments | 0 | 0 | 0 |
Analysis of Financial Statements
Ratio Analysis
2013E | 2012 | 2011 | Industry Average | |
Current ratio | * | 1.2 | 2.3 | 2.7 |
Quick ratio | * | 0.4 | 0.8 | 1.0 |
Inventory turnover | * | 4.7 | 4.8 | 6.1 |
Days sales outstanding (DSO) | * | 38.2 | 37.4 | 32.0 |
Fixed assets turnover | * | 6.4 | 10.0 | 7.0 |
Total assets turnover | * | 2.1 | 2.3 | 2.6 |
Debt-to- assets ratio | * | 82.8% | 54.8% | 50.0% |
Times interest earned (TIE) | * | -1.0 | 4.3 | 6.2 |
Operating margin | * | -2.2% | 5.6% | 7.3% |
Profit margin | * | -2.7% | 2.6% | 3.5% |
Basic earning power (BEP) | * | -4.6% | 13.0% | 19.1% |
Return on assets(ROA) | * | -5.6% | 6.0% | 9.1% |
Return on equity (ROE) | * | -32.5% | 13.3% | 18.2% |
Price/earnings (P/E) | * | -1.4 | 9.7 | 14.2 |
Market/book (M/B) | * | 0.5 | 1.3 | 2.4 |
Book value per share (BVPS) | * | $4.93 | $6.64 | n.a. |
Requiremnts:
1. Calculate XYZâs 2013 current and quick ratios based on the projected balance sheet and income statement data.
2. Calculate the 2013 inventory turnover, days sales outstanding (DSO), fixed assets turnover, and total assets turnover.
3. Calculate the 2013 debt-to-assets and times-interest-earned ratios.
4. Calculate the 2013 operating margin, profit margin, basic earning power (BEP), return on assets (ROA), and return on equity (ROE).
5. Calculate the 2013 price/earnings ratio, and market/book ratio.
6. Use the extended DuPont equation to provide a summary and overview of XYZâs financial condition as projected for 2013.
7. Use the following simplified 2013 balance sheet to show, in general terms, how an improvement in the DSO would tend to affect the stock price. For example, if the company could improve its collection procedures and thereby lower its DSO from 45.6 days to the 32-day industry average without affecting sales, how would that change âripple throughâ the financial statements (shown in thousands below) and influence the stock price?
Accounts receivable $878 Debt $1,545
Other current assets 1,802
Net fixed assets 817 Equity 1,952
Total assets $3,497 Liabilities plus equity $3,497
First, we need to calculate XYZâs daily sales.
Daily sales = Sales / 365
Daily sales = $7,035,600 / 365
Daily sales = $19,275.62
Target A/R = Daily sales à Target DSO
Target A/R = $19,276 Ã 32
Target A/R = $616,820
Freed-up cash = old A/R â new A/R
Freed-up cash = $878,000 â $616,820
Freed-up cash = $261,180
Note : All questions from 1-8 has been answered, but the only part I need help with to write the analysis or to provide a brief, two- to four-sentence rationale for how these calculations can be used in analyzing the financial position of a company and why they are important.
Question 1:
Quantitative Problem: Rosnan Industries' 2013 and 2012 balance sheets and income statements are shown below.
Balance Sheets: | |||
2013 | 2012 | ||
Cash and equivalents | $70 | $55 | |
Accounts receivable | 275 | 300 | |
Inventories | 375 | 350 | |
Total current assets | $720 | $705 | |
Net plant and equipment | 2,000 | 1,490 | |
Total assets | $2,720 | $2,195 | |
Accounts payable | $150 | $85 | |
Accruals | 75 | 50 | |
Notes payable | 120 | 145 | |
Total current liabilities | $345 | $280 | |
Long-term debt | 450 | 290 | |
Common stock | 1,225 | 1,225 | |
Retained earnings | 700 | 400 | |
Total liabilities and equity | $2,720 | $2,195 |
Income Statements: | |||
2013 | 2012 | ||
Sales | $2,000 | $1,500 | |
Operating costs excluding depreciation | 1,250 | 1,000 | |
EBITDA | $750 | $500 | |
Depreciation and amortization | 100 | 75 | |
EBIT | $650 | $425 | |
Interest | 62 | 45 | |
EBT | $588 | $380 | |
Taxes (40%) | 235 | 152 | |
Net income | $353 | $228 | |
Dividends paid | $53 | $48 | |
Addition to retained earnings | $300 | $180 | |
Shares outstanding | 100 | 100 | |
Price | $25.00 | $22.50 | |
WACC | 10.00% |
|
The balance in the firm's cash and equivalents account is needed for operations and is not considered "excess" cash.
What is Rosnan's 2013 net operating working capital (NOWC)?
What is Rosnan's 2013 net working capital (NWC)?
Question 2:
Balance Sheet The assets of Dallas & Associates consist entirely of current assets and net plant and equipment. The firm has total assets of $2.8 million and net plant and equipment equals $2.3 million. It has notes payable of $145,000, long-term debt of $754,000, and total common equity of $1.55 million. The firm does have accounts payable and accruals on its balance sheet. The firm only finances with debt and common equity, so it has no preferred stock on its balance sheet. Write out your answers completely. For example, 25 million should be entered as 25,000,000. What is the company's total debt? $ What is the amount of total liabilities and equity that appears on the firm's balance sheet? $ What is the balance of current assets on the firm's balance sheet? $ What is the balance of current liabilities on the firm's balance sheet? $ What is the amount of accounts payable and accruals on its balance sheet? [Hint: Consider this as a single line item on the firm's balance sheet.] $ What is the firm's net working capital? $ What is the firm's net operating working capital? $ What is the monetary difference between your answers to part f and g? |
Additional funds needed
Morrissey Technologies Inc.'s 2012 financial statements are shown here.
Morrissey Technologies Inc.: Balance Sheet as of December 31, 2012 | ||||
Cash | $180,000 | Accounts payable | $360,000 | |
Receivables | 360,000 | Notes payable | 56,000 | |
Inventories | 720,000 | Accrued liabilities | 180,000 | |
Total current assets | $1,260,000 | Total current liabilities | $596,000 | |
Long-term debt | 100,000 | |||
Fixed assets | 1,440,000 | Common stock | 1,800,000 | |
Retained earnings | 204,000 | |||
Total assets | $2,700,000 | Total liabilities and equity | $2,700,000 |
Morrissey Technologies Inc.: Income Statement for December 31, 2012 | |||
Sales | $3,600,000 | ||
Operating costs including depreciation | 3,279,720 | ||
EBIT | $320,280 | ||
Interest | 20,280 | ||
EBT | $300,000 | ||
Taxes (40%) | 120,000 | ||
Net Income | $180,000 | ||
Per Share Data: | |||
Common stock price | $45.00 | ||
Earnings per share (EPS) | $1.80 | ||
Dividends per share (DPS) | $1.08 |
Suppose that in 2013, sales increase by 15% over 2012 sales. The firm currently has 100,000 shares outstanding. It expects to maintain its 2012 dividend payout ratio and believes that its assets should grow at the same rate as sales. The firm has no excess capacity. However, the firm would like to reduce its Operating costs/Sales ratio to 89.5% and increase its total debt-to-assets ratio to 30%. (It believes that its current debt ratio is too low relative to the industry average.) The firm will raise 30% of 2013 forecasted total debt as notes payable, and it will issue long-term bonds for the remainder. The firm forecasts that its before-tax cost of debt (which includes both short-term and long-term debt) is 12%. Assume that any common stock issuances or repurchases can be made at the firm's current stock price of $45.
- Construct the forecasted financial statements assuming that these changes are made. What are the firm's forecasted notes payable and long-term debt balances? What is the forecasted addition to retained earnings? Round your answers to the nearest cent.
Morrissey Technologies Inc. Pro Forma Income Statement December 31, 2013 2012 2013 Pro Forma Sales $3,600,000 $ Operating costs (includes depreciation) 3,279,720 $ EBIT $320,280 $ Interest expense 20,280 $ EBT $300,000 $ Taxes (40%) 120,000 $ Net Income $180,000 $ Dividends $ $ Addition to RE $ $ Morrissey Technologies Inc. Pro Forma Balance Statement December 31, 2013 2012 2013 Pro Forma Cash $180,000 $ Accounts receivable 360,000 $ Inventories 720,000 $ Fixed assets 1,440,000 $ Total assets $2,700,000 $ Payables + accruals $540,000 $ Short-term bank loans 56,000 $ Total current liabilities $596,000 $ Long-term bonds 100,000 $ Total debt $696,000 $ Common stock 1,800,000 $ Retained earnings 204,000 $ Total common equity $2,004,000 $ Total liab. and equity $2,700,000 $ - If the profit margin remains at 5% and the dividend payout ratio remains at 60%, at what growth rate in sales will the additional financing requirements be exactly zero? In otherwords, what is the firm's sustainable growth rate? (Hint: Set AFN equal to zero and solve for g.) Round your answer to two decimal places.
%