- Complete Table 1. Summarize your calculations and use Microsoft Excel.
- Using Excel, draw one graph showing average fixed costs, average variable costs, average total costs, marginal revenue, and marginal costs.
- Using the data in the table and on your graph, what is the profit maximizing, or loss minimizing level of output? Explain and justify your answers.
- What is a normal profit? What is an economic profit? Explain your answer using examples. Are normal profits being earned in this example? Are economic profits present for this firm in this example? Explain your answers.
- Given the data in the table and the graph, how could you determine or identify the optimal plant size?
- What is the difference between explicit and implicit cost? Explain your answers.
- How would we determine if a cost is a fixed cost or a variable cost?
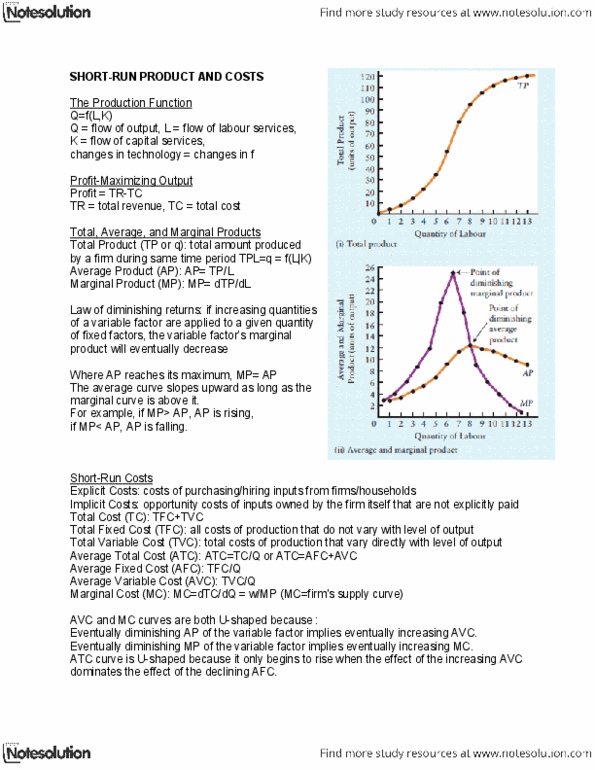
Output
Average Fixed cost Average Variable Cost Average Total Cost Marginal Cost Price Total Revenue Marginal Revenue 0 $ 345.00 1 $ 180.00 $ 135.00 $ 315.00 $ 300.00 2 $ 90.00 $ 127.50 $ 217.50 $ 249.00 3 $ 60.00 $ 120.00 $ 180.00 $ 213.00 4 $ 45.00 $ 112.50 $ 157.50 $ 189.00 5 $ 36.00 $ 111.00 $ 147.00 $ 165.00 6 $ 30.00 $ 112.50 $ 142.50 $ 144.00 7 $ 25.71 $ 115.70 $ 141.41 $ 126.00 8 $ 22.50 $ 121.90 $ 144.40 $ 111.00 9 $ 20.00 $ 130.00 $ 150.00 $ 99.00 10 $ 18.00 $ 139.50 $ 157.50 $ 87.00
- Complete Table 1. Summarize your calculations and use Microsoft Excel.
- Using Excel, draw one graph showing average fixed costs, average variable costs, average total costs, marginal revenue, and marginal costs.
- Using the data in the table and on your graph, what is the profit maximizing, or loss minimizing level of output? Explain and justify your answers.
- What is a normal profit? What is an economic profit? Explain your answer using examples. Are normal profits being earned in this example? Are economic profits present for this firm in this example? Explain your answers.
- Given the data in the table and the graph, how could you determine or identify the optimal plant size?
- What is the difference between explicit and implicit cost? Explain your answers.
- How would we determine if a cost is a fixed cost or a variable cost?
| Output | Average Fixed cost | Average Variable Cost | Average Total Cost | Marginal Cost | Price | Total Revenue | Marginal Revenue |
| 0 | $ 345.00 | ||||||
| 1 | $ 180.00 | $ 135.00 | $ 315.00 | $ 300.00 | |||
| 2 | $ 90.00 | $ 127.50 | $ 217.50 | $ 249.00 | |||
| 3 | $ 60.00 | $ 120.00 | $ 180.00 | $ 213.00 | |||
| 4 | $ 45.00 | $ 112.50 | $ 157.50 | $ 189.00 | |||
| 5 | $ 36.00 | $ 111.00 | $ 147.00 | $ 165.00 | |||
| 6 | $ 30.00 | $ 112.50 | $ 142.50 | $ 144.00 | |||
| 7 | $ 25.71 | $ 115.70 | $ 141.41 | $ 126.00 | |||
| 8 | $ 22.50 | $ 121.90 | $ 144.40 | $ 111.00 | |||
| 9 | $ 20.00 | $ 130.00 | $ 150.00 | $ 99.00 | |||
| 10 | $ 18.00 | $ 139.50 | $ 157.50 | $ 87.00 |

Related textbook solutions


Related questions
The following questions address some of the price and output decisions faced by firms other than those found in perfect competition. Some numbers may be rounded.
Table 1
| Output | Average Fixed cost | Average Variable Cost | Average Total Cost | Marginal Cost | Price | Total Revenue | Marginal Revenue |
| 0 | $ 345.00 | ||||||
| 1 | $ 180.00 | $ 135.00 | $ 315.00 | $ 300.00 | |||
| 2 | $ 90.00 | $ 127.50 | $ 217.50 | $ 249.00 | |||
| 3 | $ 60.00 | $ 120.00 | $ 180.00 | $ 213.00 | |||
| 4 | $ 45.00 | $ 112.50 | $ 157.50 | $ 189.00 | |||
| 5 | $ 36.00 | $ 111.00 | $ 147.00 | $ 165.00 | |||
| 6 | $ 30.00 | $ 112.50 | $ 142.50 | $ 144.00 | |||
| 7 | $ 25.71 | $ 115.70 | $ 141.41 | $ 126.00 | |||
| 8 | $ 22.50 | $ 121.90 | $ 144.40 | $ 111.00 | |||
| 9 | $ 20.00 | $ 130.00 | $ 150.00 | $ 99.00 | |||
| 10 | $ 18.00 | $ 139.50 | $ 157.50 | $ 87.00 |
Questions:
- Complete Table 1. Summarize your calculations and use Microsoft Excel.
- Using Excel, draw one graph showing average fixed costs, average variable costs, average total costs, marginal revenue, and marginal costs.
- Using the data in the table and on your graph, what is the profit maximizing, or loss minimizing level of output? Explain and justify your answers.
- What is a normal profit? What is an economic profit? Explain your answer using examples. Are normal profits being earned in this example? Are economic profits present for this firm in this example? Explain your answers.
- Given the data in the table and the graph, how could you determine or identify the optimal plant size?
- What is the difference between explicit and implicit cost? Explain your answers.
- How would we determine if a cost is a fixed cost or a variable cost?
Present your analysis in Microsoft Excel format. Enter non-numerical responses in the same worksheet using textboxes. If you want to learn how to use Microsoft Excel to create curves, refer to the Microsoft Excel tutorials.

For this assignment you will do a significant portion of work in MS Excel and import it into an MS Word document for submission. You will use the data below to address Price and Output decisions faced by firms that are not in pure competition. Some numbers may be rounded.
|
Table 1 |
|||||||
|
Output |
Average Fixed cost |
Average Variable Cost |
Average Total Cost |
Marginal Cost |
Price |
Total Revenue |
Marginal Revenue |
|
0 |
$ 345.00 |
||||||
|
1 |
$ 180.00 |
$ 135.00 |
$ 315.00 |
$ 300.00 |
|||
|
2 |
$ 90.00 |
$ 127.50 |
$ 217.50 |
$ 249.00 |
|||
|
3 |
$ 60.00 |
$ 120.00 |
$ 180.00 |
$ 213.00 |
|||
|
4 |
$ 45.00 |
$ 112.50 |
$ 157.50 |
$ 189.00 |
|||
|
5 |
$ 36.00 |
$ 111.00 |
$ 147.00 |
$ 165.00 |
|||
|
6 |
$ 30.00 |
$ 112.50 |
$ 142.50 |
$ 144.00 |
|||
|
7 |
$ 25.71 |
$ 115.70 |
$ 141.41 |
$ 126.00 |
|||
|
8 |
$ 22.50 |
$ 121.90 |
$ 144.40 |
$ 111.00 |
|||
|
9 |
$ 20.00 |
$ 130.00 |
$ 150.00 |
$ 99.00 |
|||
|
10 |
$ 18.00 |
$ 139.50 |
$ 157.50 |
$ 87.00 |
Address the following:
Complete Table-1. Summarize your calculations.
Prepare a graph showing:
Average Fixed Costs
Average Variable Costs
Average Total Costs
Marginal Revenue
Marginal Costs
Using the data in the table and on your graph, explain the profit maximizing, or loss minimizing level of output.
Define a normal profit and an economic profit. Are normal profits being earned in this example? Are economic profits present for this firm in this example? Explain your answers.
Given the data in the table and the graph, what type of market structure could this be in the short run? Explain your answers.
If the data in Table-1 represents the long run, what type of firm must this data represent? Explain your answers.