6
answers
0
watching
254
views
18 Mar 2018
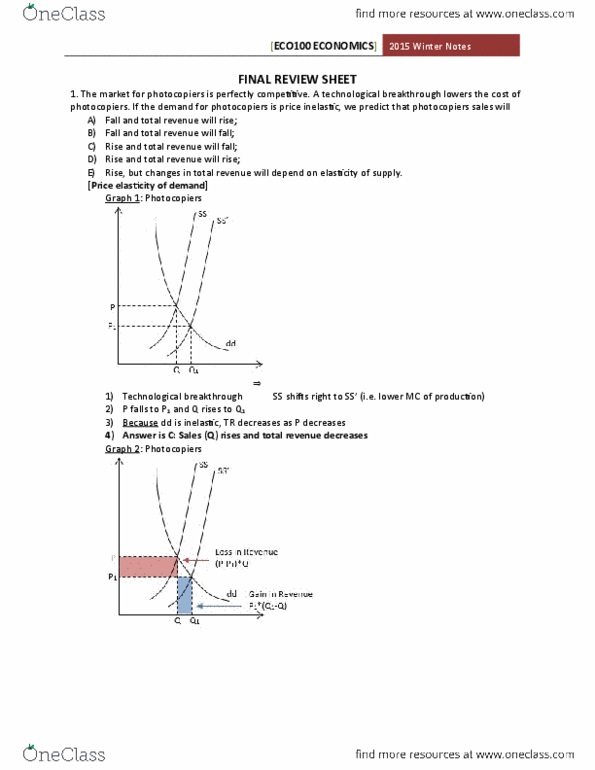
Use the figure below to answer the following question. Total revenue and total cost (dollars) C TR Quantity Figure 8 43) Refer to Figure 8, which shows a perfectly competitive firm's total revenue and total cost curves. Which one of the following statements is false? A) At an output of Q1 units a day, the firm makes zero economic profit. B) At an output of Q2 units a day, the firm incurs an economic loss. C) At an output greater than Q3 units a day, the firm incurs an economic loss. D) Economic profit is the vertical distance between the total revenue curve and the total cost curve. E) At an output less than Q1 units a day, the firm incurs an economic loss.
Use the figure below to answer the following question. Total revenue and total cost (dollars) C TR Quantity Figure 8 43) Refer to Figure 8, which shows a perfectly competitive firm's total revenue and total cost curves. Which one of the following statements is false? A) At an output of Q1 units a day, the firm makes zero economic profit. B) At an output of Q2 units a day, the firm incurs an economic loss. C) At an output greater than Q3 units a day, the firm incurs an economic loss. D) Economic profit is the vertical distance between the total revenue curve and the total cost curve. E) At an output less than Q1 units a day, the firm incurs an economic loss.


larryrambo777Lv10
12 Mar 2023
Already have an account? Log in


Trinidad TremblayLv2
19 Mar 2018
Already have an account? Log in