1
answer
0
watching
185
views
15 Jul 2018
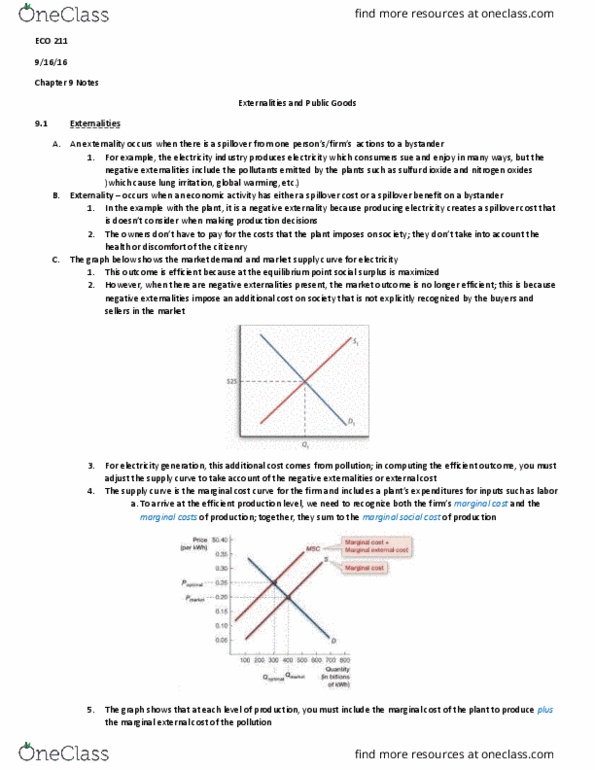
Lise the figure below to answer the following questions. Marginal cost and marginal benefit boules of pop per bicycle 0 1 2 3 4 5 6 Bicycles (thousands per month) Figure 2.2.1 4) In Figure 2.2.1, the curve labeled B shows A) that the benefits from producing more bicycles is greater than the benefits from producing more pop. B) the bicycles that people are willing to forgo to get another bottle of pop- c) the bottles of pop that people must forgo to get another bicycle. D) the bottles of pop that people are willing to forgo to get another bicycle. E) that the benefits from producing more pop is greater than the benefits from producing more bicycles.
Lise the figure below to answer the following questions. Marginal cost and marginal benefit boules of pop per bicycle 0 1 2 3 4 5 6 Bicycles (thousands per month) Figure 2.2.1 4) In Figure 2.2.1, the curve labeled B shows A) that the benefits from producing more bicycles is greater than the benefits from producing more pop. B) the bicycles that people are willing to forgo to get another bottle of pop- c) the bottles of pop that people must forgo to get another bicycle. D) the bottles of pop that people are willing to forgo to get another bicycle. E) that the benefits from producing more pop is greater than the benefits from producing more bicycles.

Hubert KochLv2
18 Jul 2018