A student finds that the kinetics graphs are most linear for ln(CV) vs. time. The first trial, with .050M NaOH, has a linear graphs with the best-fit equation y= -.00495x + .158. the second trial, run with .10M NaOH, has a linear graph with the best-fit equation y= -.00922x + .176. Based on these data, determine the overall rate law.
The rate of the reaction Y+Z to YZ is studied much like the reaction in this lab, except that both y and z absorb visable light, thus their concentrations can both be measured directly in a spectrophotometer. in trial 1, Z is held constant and Y is measured over time, producing the top three graphs. ( The top three graphs are (y) in a straight line decreasing with time. the second is ln(Y) starting high and slowly curving down over time. the third is 1/(Y) starting low and curving up). In trial 2 y is held constant and Z is measured over time. producing the bottom three graphs. based on these graphs, write the rate law for this reaction.
I know the second question is confusing but how do you determine the rate law for a reaction looking at the graphs of (y) ln(Y) and 1/(Y) and the same with Z.

Related textbook solutions

Basic Chemistry

Principles of Chemistry Molecular Approach

Chemistry: Structure and Properties

Principles of Chemistry Molecular Approach

Chemistry: A Molecular Approach

Chemistry: A Molecular Approach

Principles of Chemistry: A Molecular Approach

Chemistry: The Central Science
Related questions


Relating plots to the order of a reaction
Consider the following reaction:
Aâproducts
The plot of [A] versus t is linear for the zero-order reaction, the plot of ln[A]versus t is linear for the first-order reaction, and the plot of 1[A] versus t is linear for the second-order reaction. [A]represents the concentration of the reactant A.
| Reaction order | Linear plot |
| zero | [A] vs. t |
| first | ln[A] vs. t |
| second | 1[A] vs. t |
The linearity of each graph can be used to identify the order of a reaction.
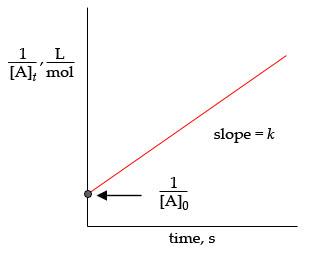
Characteristics of second-order reactions
For a second-order reaction, [A]âproducts, the rate of the reaction is given as rate= k[A]2, where k is the rate constant and [A] is the concentration of reactant A. The integrated rate law for second-order reactions is 1[A]t=kt+1[A]0, where [A]t is the concentration of reactant Aat time t, k is the rate constant, and [A]0 is the initial concentration of reactant A. This equation is of the type y=mx+b. Therefore, the plot of 1[A]tversus time is always a straight line with a slope k and a y intercept 1[A]0.
Consider the second-order reaction: 2HI(g)âH2(g)+I2(g) Use the simulation to find the initial concentration [HI]0 and the rate constant k for the reaction. What will be the concentration of HI after t = 7.05Ã1010 s ([HI]t) for a reaction starting under the condition in the simulation?
