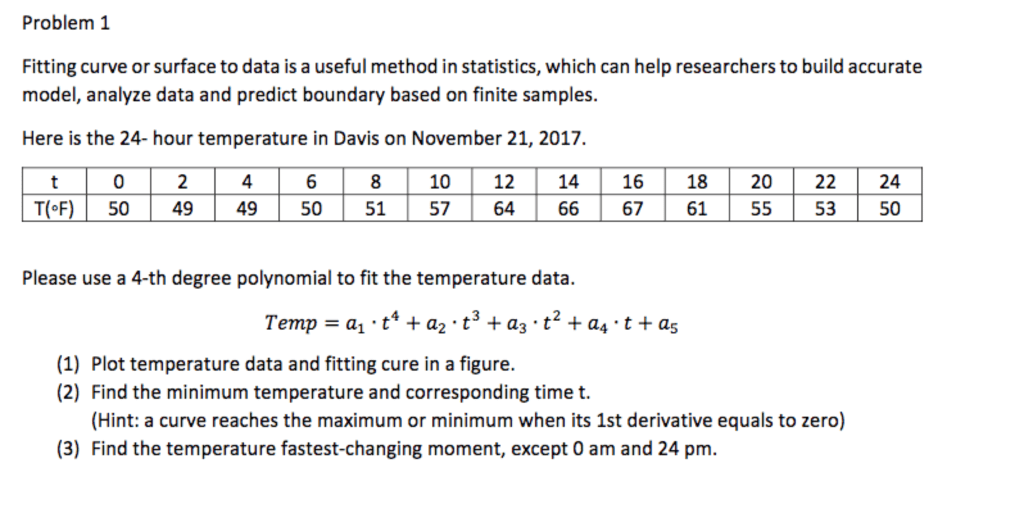
Problem 1 Fitting curve or surface to data is a useful method in statistics, which can help researchers to build accurate model, analyze data and predict boundary based on finite samples. Here is the 24- hour temperature in Davis on November 21, 2017. 2 4 6 81012 14 16 18 20 22 24 TF) 50 49 49 50 51 57 646 67 61 555350 Please use a 4-th degree polynomial to fit the temperature data. (1) Plot temperature data and fitting cure in a figure. (2) Find the minimum temperature and corresponding time t. (Hint: a curve reaches the maximum or minimum when its 1st derivative equals to zero) (3) Find the temperature fastest-changing moment, except 0 am and 24 pm.