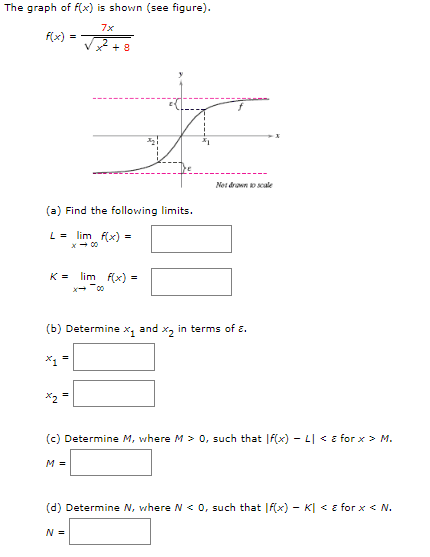
The graph of fx) is shown (see figure) Not down scalke (a) Find the following limits L= lim Rx) = K= lim f(x)= (b) Determine x1 and x2 in terms of ε. (c) Determine M, where M > 0, such that lf(x)-L| M. M= (d) Determine N, where N
Show transcribed image textThe graph of fx) is shown (see figure) Not down scalke (a) Find the following limits L= lim Rx) = K= lim f(x)= (b) Determine x1 and x2 in terms of ε. (c) Determine M, where M > 0, such that lf(x)-L| M. M= (d) Determine N, where N