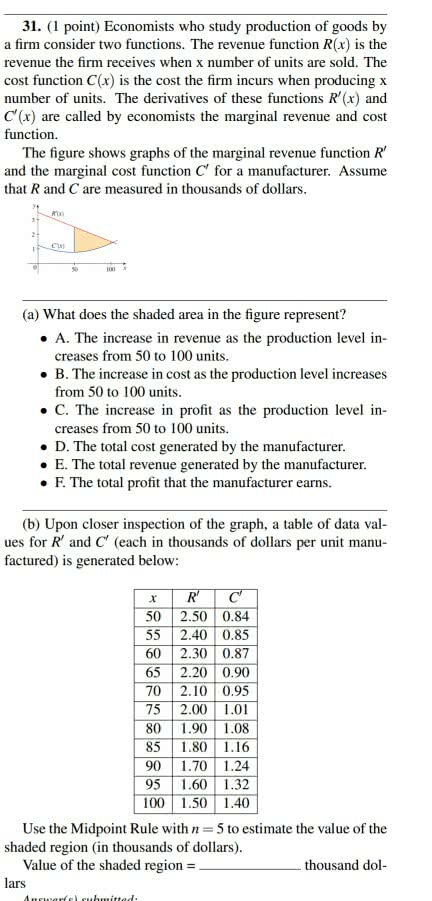
31. (1 point) Economists who study production of goods by a firm consider two functions. The revenue function R(x) is the revenue the firm receives when x number of units are sold. The cost function C(x) is the cost the firm incurs when producing x number of units. The derivatives of these functions R'(x) and C'(x) are called by economists the marginal revenue and cost function. The figure shows graphs of the marginal revenue function R and the marginal cost function C for a manufacturer. Assume that R and C are measured in thousands of dollars (a) What does the shaded area in the figure represent? . A. The increase in revenue as the production level in- reases from 50 to 100 units. . B. The increase in cost as the production level increases from 50 to 100 units . C. The increase in profit as the production level in- creases from 50 to 100 units. . D. The total cost generated by the manufacturer . E. The total revenue generated by the manufacturer · F. The total profit that the manufacturer earns (b) Upon closer inspection of the graph, a table of data val ues for R' and C (each in thousands of dollars per unit manu factured) is generated below 50 2.50 0.84 65 2.20 0.90 75 2.00 1.01 80 .90 1.08 100 1.50 1.40 Use the Midpoint Rule with5 to estimate the value of the shaded region (in thousands of dollars). Value of the shaded region = thousand dol ars
Show transcribed image text31. (1 point) Economists who study production of goods by a firm consider two functions. The revenue function R(x) is the revenue the firm receives when x number of units are sold. The cost function C(x) is the cost the firm incurs when producing x number of units. The derivatives of these functions R'(x) and C'(x) are called by economists the marginal revenue and cost function. The figure shows graphs of the marginal revenue function R and the marginal cost function C for a manufacturer. Assume that R and C are measured in thousands of dollars (a) What does the shaded area in the figure represent? . A. The increase in revenue as the production level in- reases from 50 to 100 units. . B. The increase in cost as the production level increases from 50 to 100 units . C. The increase in profit as the production level in- creases from 50 to 100 units. . D. The total cost generated by the manufacturer . E. The total revenue generated by the manufacturer · F. The total profit that the manufacturer earns (b) Upon closer inspection of the graph, a table of data val ues for R' and C (each in thousands of dollars per unit manu factured) is generated below 50 2.50 0.84 65 2.20 0.90 75 2.00 1.01 80 .90 1.08 100 1.50 1.40 Use the Midpoint Rule with5 to estimate the value of the shaded region (in thousands of dollars). Value of the shaded region = thousand dol ars