1
answer
0
watching
59
views
12 Nov 2019
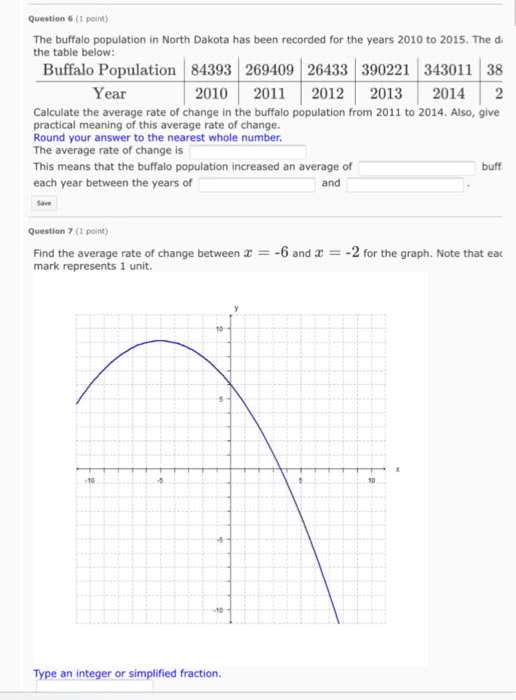
The buffalo population in North Dakota has been recorded for the years 2010 to 2015. The d. the table below: Calculate the average rate of change in the buffalo population from 2011 to 2014. Also, give practical meaning of this average rate of change. Round your answer to the nearest whole number. The average rate of change is This means that the buffalo population increased an average of buff each year between the years of and Find the average rate of change between X = -6 and X = -2 for the graph. Note that each mark represents 1 unit.
1
answer
0
watching
59
views
For unlimited access to Homework Help, a Homework+ subscription is required.
Jamar FerryLv2
11 Aug 2019